My phone had been running hot saying I had to watch this Four Corners expose of “climate change” – what a pageant of old wives tales mixed with assorted lies and exaggerations.
Starting with the “Braidwood drought” was a dud move due to rain and floods a week or so ago in the region – so that should have been cut. Surely the show has staff that are half awake?? I mean Canberra flooded!!
To use a vineyard near Adelaide as evidence of GW? – not even a pic of the weather instruments – Adelaide is barely a half degree warmer than 100 years ago despite the ever expanding urban heat island and electric instruments vs mercury in glass. Interesting too how the variation in the years has narrowed last ~decade.

How did the show choose to beat up heatwaves in Perth in the face of two cool summers as reported by – themselves!
Great shots of Perth Govt staffers having a day off work learning about heatwaves.
Perth watercrats turned to seawater desal in the face of plentiful water which would have offended the Greens to harvest. I list 6 sources where the WA Govt could easily have bolstered water supplies and avoided the energy intensive water factories the State is now stuck with for life. Once you get seawater desal you get the compulsory climate lies for life too.
This Four Corners so-called expose of “climate Change” was obnoxious, fabricated and unscientific, but then it has to be remembered that almost every episode of Four Corners is just the same, and everything that it touches as a topic turns to Leftist Dust.
Gee, however many friends asked me to turn to “our ABC,” I think I would have stayed on Air Crash investigations rather than watch Four Corners Crash and burn.
Great piece, Warwick.
I watched the ‘report’ only up to the Braidwood section – couldn’t take it anymore.
So I sent an email to 4 Corners asking why MB, the presenter, didn’t check the data and question those being interviewed.
Don’t expect to hear back.
Facts
Braidwood – at best an 0.3C rise since 1907.
Hottest year – 1919.
Many of the hottest years were in the first half of the 1900s.
Only months with a max mean over 30C were before 1969 – none since (although no data from 1974-1992).
And if we are getting hotter (as our BoM expert tells us), then why has there there only been +50C three times – twice in 1960 and once in 1998.
Perth Water Corporation CEO Sue Murphy says “…so we need to have a supply that will deal with climate change and will also deal with the odd extreme event, so if we do get lots of rain, we need to capture that and use it.” Facts are very little rain will end up in dam inflows unless catchments are managed.
Whole ABC presentation was so dishonest no questions at all just free kicks to their approved echo chamber.
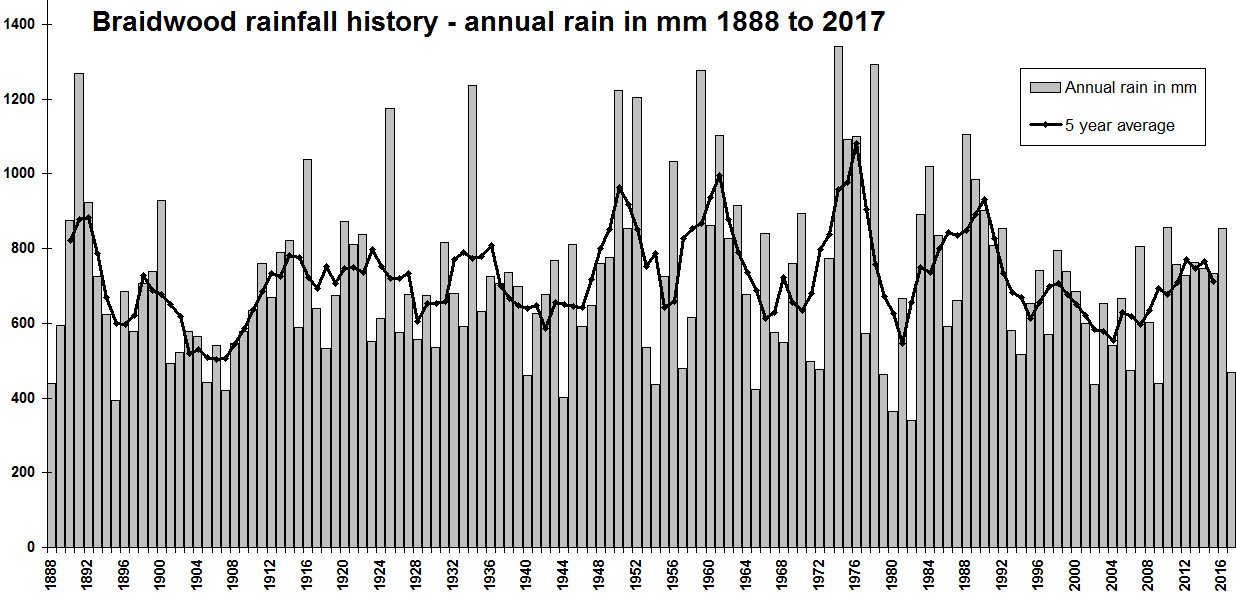
As far as the Braidwood drought goes, every year from 2010 – 2016 inclusive had above average rainfall. 2017 was well below (but nowhere near the lowest) and this year has started off above average.
I posted this chart of Braidwood rain history in Jan. As you say one dry year. The ABC has a rich history beating up drought. ABC report Braidwood drought but it is one dry year. Large chart.
Thinking about what the WA Govt did in turning to seawater desal – turning their backs on the global hydrological cycle – beat that for an anti-science policy shift!! That required all their mad “anti-rain” claims and slogans that still infest WA to this day. How many WA people if asked would have a clue that from the Swan to the Warren ~1000GL PA river water(still valuable if weakly saline) wastes to the sea. Over 3 times Perth consumption.
When you think about it nationally this is simply Greens policy –
No new dams or water schemes –
If a dam exists kneecap it with environmental flows –
Rain water should to the max – run to the sea.
Talk up water as “precious”.
Irrigators under constant pressure.
And that with minor exceptions is pretty much where we are nationally.
Another excellent post, Warwick.
I had a look to see if I could determine the source of the Adelaide temperature data. For the period of the uptick, say 1997 to 2007, it seems the readings must have come from the Kent Town station, at the BoM office. A look on Google shows the Stevenson screen and other instruments located here: www.google.com.au/maps/place/25+College+Rd,+Kent+Town+SA+5067/@-34.921031,138.6212836,93m/data=!3m1!1e3!4m5!3m4!1s0x6ab0c9496f8f6ef1:0xf388a7415b066e22!8m2!3d-34.9214752!4d138.6220881
Note the large amount of fairly new building in the area, and especially the carparks and other tarmac to the northwest, west and southwest of the instruments, including some cars only 15 metres from the Stevenson screen. That sort of change in the local environment could easily explain the 0.5 to 1 degree temperature hike over the last 20 years. Also, if the construction was completed a few years back – as looks to be the case if you go down to Street View level and wander round the block – this would explain the levelling off of the hike since.
I avoided watching the episode, I could tell from the preview how it was going to play out. I’m at the point of not watching or reading anything from the ABC except maybe doing my part, like Ian George and start calling them out on their climate change propaganda.