There are two temperature series for Cape Bruny on the southern tip of Tasmania. CAPE BRUNY LIGHTHOUSE 94010 and it seems that an AWS was commenced in 2002 CAPE BRUNY 94198. The BoM site map shows the screen and AWS are ~18m apart.

I downloaded the max and min monthly data from CDO online and for the years of overlap 2002 to 2016 the CAPE BRUNY 94198 annual max is 0.45° warmer on average than CAPE BRUNY LIGHTHOUSE 94010. Furthermore the AWS was warmer than Lighthouse in every year.
For the same period the CAPE BRUNY 94198 annual min is 0.16° cooler on average than CAPE BRUNY LIGHTHOUSE 94010. Furthermore the AWS was cooler than Lighthouse in 15 of the 19 years, the readings were the same for 2008 and 2012, 2013, 2014. An interesting case of BoM AWS reading on an annual mean temperature basis (how global warming is measured), consistently 0.29° C higher than Stevenson screen readings only 18 metres away. Yet the BoM maintain their AWS are calibrated to be equivalent to liquid in glass thermometers.
Well spotted, Warwick.
The max difference is mostly in warm to hot weather, which ties in with evidence that the hotter it is, the more outliers will be recorded by AWS electronic thermometers.
Based on daily maxima from CDO between 2002 and 2016, below are how much warmer 94198 was than 94010 for monthly averages …
Jan 0.63C
Feb 0.69C
Mar 0.56C
Apr 0.47C
May 0.18C
Jun 0.15C
Jul 0.14C
Aug 0.28C
Sep 0.43C
Oct 0.60C
Nov 0.68C
Dec 0.70C
Below shows how much cooler 94198 was than 94010 each month, with June being warmer …
Jan -0.20C
Feb -0.24C
Mar -0.15C
Apr -0.15C
May -0.15C
Jun +0.05C
Jul -0.19C
Aug -0.10C
Sep -0.12C
Oct -0.15C
Nov -0.22C
Dec -0.21C
Dailies show 94198 annual max 0.45C warmer and annual min 0.17C cooler than 94010.
Albeit in opposite directions, both the max and min trends seem to be swayed by average monthly air temperature rather than other possible environmental, screen or site location influences.
Maybe that’s better expressed as for how many seconds the air temperature is averaged by the AWS.
Thank you for this Warwick.
Would be good to know if the screens are the same size. Have searched for Photos but no luck. Did find this “However, Blair says seeing the sites in person sometimes has more than symbolic value. While the Bureau has extensive documentation about its sites in databases and, for older information, on paper—some of the subtle influences on local climates are hard to appreciate without being there. ‘One example is at Cape Bruny in Tasmania, where we have two sites 50 m apart, one on the top of a hill and one just off to the side in a more sheltered location. Visiting there on a windy, showery, day made me appreciate how much more exposed the hilltop site is, and it turns out the hilltop site measures 17 per cent less rain than the more sheltered one, because some of the rain blows over the top of the gauge’.” media.bom.gov.au/social/blog/1047/to-bourke-and-beyond-one-scientists-epic-journey-to-112-weather-stations/
Lance
Thanks Chris for your monthly differences – much appreciated – here is my table of max and min annual AWS minus Lighthouse differences.
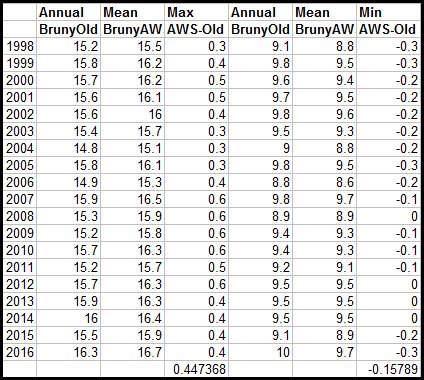
Agree Siliggy a lot to find out yet. It could be that the 94010 site has always been between the houses and has been left there when the AWS site was installed ~1997 higher up and more exposed. If that is so and all other factors being equal you might expect the old site to read a warmer max being sheltered by the houses. But reverse is so. Means that there may be bigger AWS minus LIG differences to find elsewhere over the wide brown land.
How is it that Max/Min temperatures recorded using AWS second by second averaging can be considered by the BoM to be equivalent to liquid in glass thermometers but somehow it is completely beyond the ken of the BoM to adjust historic temperature data measured using Glaisher stand mounted liquid in glass thermometers for compatibility with Stephenson screen mounted liquid in glass thermometer data?
Both sites are nearby to a large, high albedo structure (I’d say around 0.7) and any temperatures recorded would be significantly influenced by it.
Sites close to the ocean can vary significantly according to local topography, wind direction, etc.