Starting with SW WA the iconic poster-child of the lavishly State-funded climate scaremongers – exactly wrong.
SE WA and West SA big fail.
Central WA 2 wet predictions – huge fail.
Far north wet prediction mostly an utter fail.
Central NT huge wet was predicted dry – fail again.
Cooktown region wet not predicted – fail again.
West Qld wet was predicted dry – huge fail again.
SE SA and west Vic another fail.
Tas got its rain the wrong way around!!! Fail again.
First the prediction.

Then rain in July.

For large maps Outlook – July rain % – BoM Outlooks – make rain maps
It must take special skills to be so exactly wrong so often.
We pay a lot of money for these austere folk to be consistently WRONG.
It already seems the August rain outlook is going to be way off too.
The June Outlook was another complete flop.
www.bom.gov.au/jsp/sco/archive/index.jsp?map=rain&area=national&period=month1&year=2017&month=5&day=25
June actual rain percentage.
www.bom.gov.au/jsp/awap/rain/index.jsp?colour=colour&time=latest&step=1&map=percent&period=month&area=nat
Looks like we will get close to the Perth Aug rainfall record of 175mm (current location).
The BoM has awarded my part of the NSW mid-north coast nearly six inches of rain in one day (Thu 13) this past July. It’s in the books forever now.
Trouble is, it never fell. Dry deluge. Phantom flood.
There is no sign of 100mm plus on this NSW rain map for 13 July.
www.bom.gov.au/jsp/awap/rain/archive.jsp?colour=colour&map=totals&period=daily&area=ns&year=2017&month=7&day=13
If you gave me a station name I can check the daily data. I have noticed that errors can appear in daily data then be corrected days or weeks later.
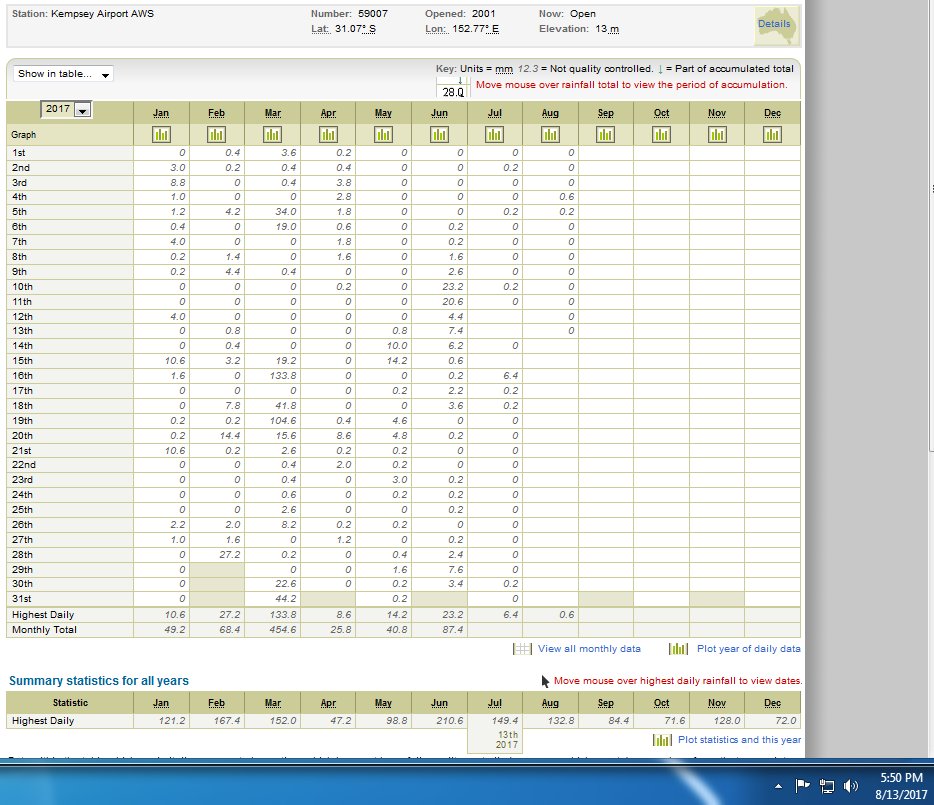
Wazz, July 13 was a dry day in Kempsey – maybe some drizzle somewhere – yet our airport supposedly received a flood which nobody I’ve asked knows anything about.
www.eldersweather.com.au/dailysummary.jsp?lt=site&lc=59007&dt=1
The BoM site offers no daily reading for the 13th but under its statistics registers the 13th Jul 2017 as highest rainfall for any July day with 149 mm.
That’s for the airport, with its short history. The airport is now our official station. Kempsey itself has a long rainfall history back to 1882 and we received 175 mm on a day in 1922.
However 149 mm would have to be noticed. It would, in fact, have caused local flooding.
But there was nothing!
That sure is a solid mis-reading of rain – presumably due to an instrument fault – not so uncommon – but the BoM now show no readings for the 12th and 13th July.
Kempsey Airport AWS Number: 59007
www.bom.gov.au/jsp/ncc/cdio/weatherData/av?p_nccObsCode=136&p_display_type=dailyDataFile&p_startYear=&p_c=&p_stn_num=059007
BoM forecasting wild weather for Perth tonight.
WA weather: Bureau warns worst of wild conditions forecast for Sunday night 13 Aug 2017
www.abc.net.au/news/2017-08-13/bureau-warns-of-more-wild-weather-over-south-west/8802202
Yep, but if you check the bottom of that page under “statistics” the reading is still valid as record for any July day.
I’m still trying to reconcile the huge difference between Wedding Cake and the Observatory on the day of Sydney’s record heat in 2013. It’s always a few degrees cooler out on the harbour…but 11.5 C cooler? It was 5 degrees hotter on Wedding Cake ten days earlier, at least according to the numbers.
I’m of that generation raised to see statistics as handy but rather trashy. It’s likely from other sources that Sydney’s 2013 record heat was not as severe and deadly as the heat of the old 1939 record. But who checks other sources any more? We’ve been conditioned to believe that memory, anecdote and old news clippings can’t intrude on the scientific purity of numbers…yet what’s the point of comparing the persistent and more widespread heat of 1939 and 1960 in Sydney to a “record” heat that was so brief?
Bare numbers don’t do it for me. I know there’s a chance that our heaviest daily rainfall in Kempsey (314 mm Apr 28 1963, added to 159 mm the day before) is real because the flood that came along with it was pretty legendary. But this phantom flood at Kempsey Airport last month has confirmed me in my skepticism about bare stats.
As for stats detailing weather which hasn’t happened yet, Warwick Hughes has been showing us for years not to rely on all that. And I don’t. Keep up the good work.
Dead right thanks – I kept a screen – the bogus 149.4mm should vanish soon.