Just as useless as our BoM – the NIWA March to May Outlook issued 1st March wrecked by heavy rain they never saw coming. They said –
Regional predictions for the March – May 2017 season
Northland, Auckland, Waikato, Bay of Plenty
Rainfall totals are about equally likely to be in the near normal (35% chance) or below normal range (40% chance).

The MetService shows that both Auckland and Hamilton had useful rain starting last Tuesday 7th March.
This COLA forecast map series shows rain hanging around Aotearoa until the Ides of March.
www.wxmaps.org/pix/aus.vv.html
Niwa March to May predictions have got off to a bad start…way off base. The Tasman Tempest has been with us since Tuesday evening with the usual resultant chaotic closures, power outages, evacuations. More rain fell in a single hour on Friday since records began in 1965. Aucklanders warned to reduce water useage by 20% due to Treatment Plants not coping. Now it is – get set for more wet – as more fronts are following, including thunderstorms and mini-tornados.
Still flooding rain in Auckland Sunday – see the NZ Herald front page as of 5pm AET.
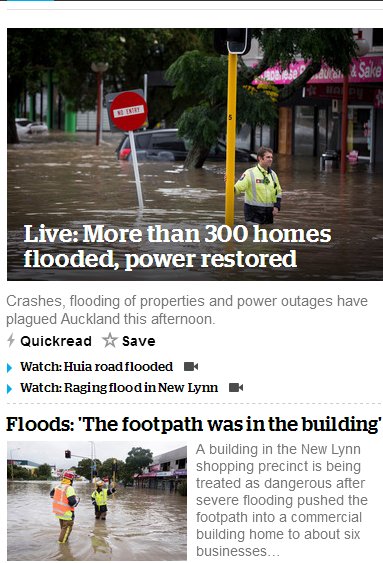
www.nzherald.co.nz/
Yes, 25mm more in Auckland city on Sunday, with 50 mm in the suburbs: www.facebook.com/MetService/photos/a.154197624642304.35091.136819026380164/1390491157679605/?type=3
Auckland total rain, first 12 days of March, over 125mm: www.weatheronline.co.nz/weather/maps/city?LANG=nz&WMO=93110&ART=PRE&CONT=nznz&R=0&LEVEL=150®ION=0029&LAND=NZ&NOREGION=0&MOD=&TMX=&TMN=&SON=&PRE=&MONAT=&OFFS=&SORT=
To be fair, NIWA seasonal forecasts are only given in probabilities of being near average, well above average or well below average. But even so they are clearly unreliable in practice, as you might already guess from the fact that they rarely assign any probabilities above 45% or below 25%. So you do wonder why they bother.
This reminds us though that weather bureaux have three timescales. The short-term forecasts they issue every day are based on masses of current information and are reliable for maybe 3 days, and vaguely reliable for another day or two after that.
Their seasonal or medium-term forecasts are based on recent sea temperature and air pressure patterns and, as we see here yet again, are barely more reliable than tossing a coin.
Their long-term or climate evolution forecasts start with speculations about economic growth, population growth, and the emissions-intensity of production. These are combined to form emissions scenarios, usually with no probabilities attached. The emissions scenarios are then fed into carbon cycle models to generate possible future carbon dioxide concentrations in the atmosphere. The concentrations are then fed into climate models which translate them into future radiative forcing at the top of the atmosphere, and then, based on a mixture of known physical processes, parameterisations and tuning, generate hypothetical future climate states at the surface. Some range of these hypothetical future climate states is then fed into models to generate hypothetical costs and benefits based on assumptions about how people will live and what they will care about decades and centuries into the future.
But if you think this is all ludicrously convoluted and far-fetched, well think again! According to essentially all the world’s governments and bureaucrats, the hypothetical costs and benefits that fall out of this Heath-Robinson contraption of models and suppositions actually represent incontrovertible findings of science fully qualified to dictate public policy, right now, on electricity, transport, industry, agriculture, housing, education and whatever. Not only that, but anyone who disagrees is a knuckle-dragging moron or a flat-earther denialist in the pay of evil oil and coal companies.
March finished in the Auckland area with roughly 3 times the average rainfall for the month, see page 4 here: www.niwa.co.nz/files/Climate_Summary_March_2017.pdf
And with only half of April gone, it has already received nearly double the average total for this month: www.shellypark.co.nz/?q=node/17
Add it together and the Auckland area, predicted to have near-average or below average rain for March to May, has already had 50 per cent more than usual total for the whole three months just in the first six weeks.
Why don’t they give up? With this sort of performance, anyone who planned anything based on their modeling forecasts might be tempted to sue…
Final “wash-up” from NIWA on their March-May forecast (link at end):
“Predicted rainfall: March – May 2017 rainfall totals were about equally likely to be near normal or below normal in all regions of the country except the west of the South Island where near normal rainfall was most likely.
“Outcome: Actual rainfall was above normal for the entire North Island and the north and east of the South Island. This pattern was driven by a handful of extreme rainfall events in March and April. In the west of the South Island, rainfall was below normal.”
If you read it carefully, the prediction, which only had three values – below normal, near normal and above normal – was wrong across almost the whole country:
North Island and South lsland except for the west: Prediction was for either normal or below normal, and thus had 67% probability of being right by sheer chance, yet it was wrong all across the North Island, and in the north and east of the South Island.
West of South Island: Prediction near normal, outcome below normal, i.e. wrong again.
Overall result: wrong in every part of the country for which an outcome was reported.
Excuse is “a handful of extreme rain events in March and April”. In other words, rainfall would have been normal or below normal like we predicted if it hadn’t been for repeated huge downpours in March and April!
And even that isn’t really true, as rainfall was still above normal across large parts of the the North Island in May: www.niwa.co.nz/files/Climate_Summary_May_2017.pdf
Woeful!
www.niwa.co.nz/climate/nzcu/new-zealand-climate-update-216-june-2017/retrospective-march-may-2017-outlook