Just ran an update as at 31 July – several Water Corporation stations look suspect – several BoM stations are out of date by months. My spreadsheet showing audit required.Source of BoM data and map – for a years daily data enter the 6 digit BoM station ID alongside Station number then click the Get Data button. Map showing dams and localities. BoM map with their sites and dams visible.
In May I reported – West Australian Govt Water Corporation fails to record March 2016 rain at several dams
From the Water Corporation’ website,
‘Groundwater and desalinated water are stored in these dams during periods of low demand so it is available when it is most needed in the hotter months.’
Madness storing desal water in dams where it can evaporate. Evaporation rates are high in Perth’s climate. Bom shows an annual evaporate rate of 1800mm for Perth. Across the surface area of the dams that is an enormous amount of water lost.
The same amount of water will evaporate from the same surface area irrespective of whether desal water is added or not. However if adding desal water significantly increases the surface area, then it could be a waste of time and power. In that case Phillip has a valid point.
I see your National Night Time Hotspot lives on in last six months min temperature anomaly map
www.bom.gov.au/jsp/awap/temp/index.jsp?colour=colour&time=latest&step=0&map=minanom&period=6month&area=nat
Valleys in the Darling Ranges (Perth Hills) aren’t particularly deep or steep sided. Never been glaciated for one thing. More water will increase surface area.
How can this be true yet rain never runs into Perth dams.
Rainfall creates good conditions for Avon Descent white-water race
www.abc.net.au/news/2016-08-05/avon-descent-river-race-preview/7696204?WT.ac=statenews_wa
Net inflows started very early this year (winter rains started early), but without knowing how much of those inflows were from desal and acquifers, we have no way of knowing how much is from river flows.
The Water Corporation must know, but they don’t seem keen to communicate the information to the public.
Catchment thinning will have a large effect on inflows. As I have pointed out before, one large native tree consumes about as much water as the average Perth household.
I wonder if the WC is collecting Carbon Credits for not clearing catchments, or having to pay for them if they do clear catchments.
If so, it’s a very perverse incentive as the alternative is desal.
There is a surprising difference in rainfall between Collie and Collie East considering they are so close. For the years since 2003 they are both open – this table shows how Collie is always higher – except in 2008 when affected by missing May & June. The table shows raw annual totals not corrected for missing data – In the old Collie column the bold totals were affected by missing months.
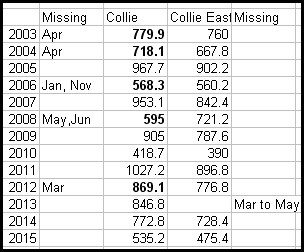
Data from here –
www.bom.gov.au/climate/data/
COLLIE (009628) is at 204.0m asl while COLLIE EAST (009994) is at 200.0m asl – so little reason there for the difference. You can see the two sites here –
www.bom.gov.au/wa/flood/southwest.shtml
I am intrigued if Collie East might be slightly sheltered.