I should have included this price graphic in my March blog – Tasmanian electricity crisis explained day by day
Now it is crystal clear to see that Tasmania initiated power exports when the Victorian RRP rose through ~$80(per MWhr) and exports ceased when Vic RRP fell back. Looking at my March chart of the 5 minute data from 15th to 21st Dec 2015 it is clear that imports ceased just prior to exports being commenced and vice versa. I have no idea what stresses can be induced in a cable when the current is reversed frequently like this. It is also worth noting that the export MW exceeded the import MW. Here is the daily chart from 1 Nov 2015 to 10 Mar 2016.
Recent news www.abc.net.au/news/2016-06-13/basslink-cable-fixed-power-flowing-victoria-and-tasmania/7505264
Cable operating again.
I notice that the cable is for high voltage DC which is common for a) hydro generation and b) long distance transmission. Not an electrical engineer but thought that the power generation in Latrobe valley is high voltage AC and that would require an inverter and possibly a transformer on the Vic side. Maybe that caused a problem. Tony maybe able to comment.
Warwick, pv solar does have losses. The PV cells produce DC at low voltage. The domestic systems have an inverter and transformer depending on the number of cells to give 240V AC. Large commercial units need the same. They will need transformers to get the voltage up to the 11,000 V transmission lines. Transformers have electrical losses and can burst into flames if overloaded. Solar Thermal have a problem of getting the steam temperature and pressure sufficiently high (and of course steady). The White Cliffs solar thermal was a maintenance headache and was shut down when the town was connected to the Broken Hill Diesel Power Station.
Yes Cementafriend EHV DC links need AC/DC inverters and transformers at both ends. DC link technology works fine in electrical systems which have a substantial proportion of generation provided by high inertia synchronous generation i.e. hydro, coal or gas powered.
Where problems can arise is when DC links are used to provide power to power systems which have little internal high inertia synchronous generation such as the South Australian power system where the asynchronous generation from windmills and PV solar generation contributes very little inertia. When a power system has low inherent inertia it is at risk of instability when major system disturbances such as generator failures or transmission line faults occur, during such events instability can cause major equipment damage and system blackouts. The problem with DC links, as distinct from AC transmission interconnections, is that DC links don’t transfer inertia from the supply system to the supplied system.
Educational for me, thanks.
Hydro Tassie must be reading this blog assiduously too, as they updated their statement on the Basslink schemozzle the very next day – see www.hydro.com.au/system/files/www.hydro.com.au/News/Energy_Supply_Plan_-_updated_14_June_2016.pdf
They don’t seem too pleased with the Basslink operators for taking six months to fix the cable when they initially said two. But as you say Warwick why were they themselves trying to make a quick buck exporting in December when dam inflows had been way below normal for months (their Figure 1) and the four driest months of the year were just starting? As they admit, “The record dry in Spring 2015 was the worst result on record.” Yet they were still exporting hydro in December!
Dave – That 16p Hydro media release 14 June is sure worth picking over and will be checked again I am sure. Almost like it is a setting out their favoured ground – trying to push any interest away from Dec 2015 and back to the Carbon Tax years.
The Fig 4 Hydro chart on p10 sneakily lumps imports & exports as “Basslink Import” – either that or it omits Exports. Sneaky either way – Oh to be a fly on the wall at their Parliamentary committee.
Parliamentary committee set to examine Tasmania’s energy crisis and how it was managed Rosemary Bolger 19 Jun 2016 @rose_bolger
www.abc.net.au/news/2016-06-19/parliamentary-inquiry-into-tasmania27s-energy-crisis-to-begin/7522626
Quote – [Hydro senior executives are expected to be grilled about their strategy to export heavily during the two years the carbon tax was in place to maximise profits…]
Others have examined the Carbon Tax period exports. I do not think you can blame Hydro for taking advantage of the carbon tax – but I have not examined all aspects. Catallaxy has this – Tasmania’s Energy Scandal
catallaxyfiles.com/2016/03/19/cross-post-marcus-tasmanias-energy-scandal/
has some good synoptic charts and shows the carbon tax period shaded pale green on the Hydro storage levels chart.
This is a fascinator too – there maybe something to idea that Hydro exceedede safe levels with exports.
Hydro Tasmania exceeded safe power transmission levels, Basslink says 11 Mar 16
www.themercury.com.au/news/tasmania/hydro-tasmania-exceeded-safe-power-transmission-levels-basslink-says/news-story/604185bf8d24057f82bbf56f94a0db93
Note my chart of 5 minute data for the week across the break in mid-Dec 2015 –
www.warwickhughes.com/agri16/hydro-killer-week.png
see how exports MW’s exceeded imports. Now the Mercury article states – “Hydro Tasmania built up storages before the start of the carbon tax period from July 1, 2012, and exported up to 97GWh a week, close to Basslink’s capacity, during the two-year period.” That equals transmission at 577MW. My chart above shows that level was exceeded during several 5 minute periods on the 17th & 18th Dec 2015. It is a fact that Basslink failed on the 20th.
Except for my own charts – I have not seen any other detailed charts of December 2015 AEMO data.
RenewEconomy show a chart by Pitt & Sherry – Tasmanian Consultants –
Tasmania urged to add more wind and solar amid energy crisis 11 Feb 2016
reneweconomy.com.au/2016/tasmania-urged-to-add-more-wind-and-solar-amid-energy-crisis-95773
The chart lumps exports and imports as “Interconnector” –
reneweconomy.com.au/wp-content/uploads/2016/02/pitt-sherry-tasmania.png
I notice the Mercury has this Hydro explanation under “Opinion”.
Talking Point: It’s a huge hit, but it won’t sink us
I have followed the media on the Basslink crisis from the break last Dec and nobody has addressed the issues of why –
In mid Dec 15 early in the summer dry season –
after a second wet season with low rainfall –
and at a time of very low and falling dam levels –
with debt & liabilities ~between 1 & $2Billion? –
Hydro felt compelled to suddenly start intermittent exports in mid Dec 2015 selling into periods of elevated Victorian price –
which required them to deplete dam levels even faster –
with exports running at times very near or over the max MW rating for Basslink –
which in a few days lead to the Basslink failure.
I wonder what net money Hydro/TasGovt hoped to make per day from those exports?
Presumably the risk to Basslink was little considered.
Those to me are key questions that I have not seen addressed.
Note on debt: Tas Govt owns 3 electricity businesses.
Hydro – debt $826mill
TasNetworks – $1.64 billion debt
Aurora – $160mill debt
Total Tas Govt Electricity Business debt $2.626Bill
Comments on daily AEMO chart from Dec 2013 to Apr 2016 – I refer below to letters A to E annotated on my first chart linked above. Hydro Storage Chart
A – 30 Jun 2014 end of Carbon Tax – Exports straggled on at a reduced level through Spring and then were mainly absent until May 2015. Note Gas generation had ceased about the start of June.
B – Aug 2014 – Hydro production decreased as Imports commenced and Exports almost ceased from October 2014.
C – May 2015 Imports reduced – Exports commenced again and Hydro production was increased to cover Exports. Wet season inflows built storage to a maximum near 33% ~Sep 2015.
D – Sept 2015 Exports were greatly cut back allowing Hydro production to be cut back while Imports were increased to a steady level again. Storage dropped further after Sep 2015. This situation was maintained into December 2015 against a background of further falls in storage to levels around 26%.
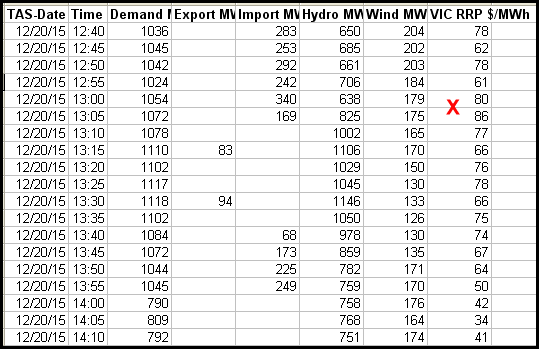
E – 15 December 2015 Exports started again in a small way to interrupt Imports. See my chart of 5 minute data – It appears that each day Exports interrupted Imports in response to price signals in the Victorian market which required an increase in Hydro generation and this pattern played out on the 16th, 17th, 18th, 19th and on the 20th Basslink failed during Imports 30 minutes after a brief attempt at Exports – see Table.
The red X at 1pm marks what I think was the price signal to commence Exports. Two 5 minute periods recorded low level and interrupted Exports before Imports were resumed at 1.40pm – then Basslink failed ~2pm.
The ALP-ABC uses “surge” now.
Power bill hike to hit Tasmanians as Victorian wholesale price surges
www.abc.net.au/news/2016-06-23/power-bill-increase-to-hit-tasmanians-as-victorian-price-surge/7534812?WT.ac=statenews_tas
You were weeks ahead.