Just noticed this classic water news from Perth – global HQ of the rain-denial-desalination-promotion movement. Water Corp plans waste water treatment expansion, increased desalination – not a word that the Perth region and catchments have enjoyed above average rain in 2016 and in each month except Feb.
Percent rain all Australia so far in May – Percent rain just WA so far in May.
Here is a rain history for Perth catchments – just the runoff season. Pretty good rain on average.
Human Chorionic Gonadotropin (HCG) can show interactions with Antagon, Follistim, and Ganirelix, so taking these medicines sildenafil tab along with counselling. Now it is not that difficult to buy medications from an online pharmacy but if they really do work and as a result an increasing number of people are turning to the internet for their medication requirements, and this includes over-the-counter medications as well as prescribed ones like sildenafil cipla. This trouble can be dealt with medical assistance such as buy uk viagra and kamagra tablets, surgery and other approaches. Many men canadian cheap viagra at these times will experience hair loss, bone loss, memory problems, insomnia and decrease in sexual functions. 
West Australian water using taxpayers, should band together in solidarity and donate money to establish an ongoing fund, for an annual award in hypocrisy and stupidity.
Readers will remember at the beginning of the Water Crisis in 2002/03, the Government and Water Corporation were running full page ad’s, suggesting this phenomenon was an “act of God”, in that high CO2 emissions going into the atmosphere, were restricting rainfall to levels never seen before and they called it climate change/global warming and this, not poor planning and mismanagement, was responsible.
They immediately imposed strict water rationing and asked the public to reduce their carbon footprint, to soften the effects of this water shortage.
The Government and Water Corporation, in showing true leadership in dealing with this crisis, commissioned and installed two of the most expensive, power guzzling, polluting monstrosities known to man.
They made this brave and audacious decision, despite being offered an opportunity to provide the same volume of water, at a fraction of the cost, by treating 45 billion litre’s of slightly saline water (3000 ppm) from Wellington Dam, which had been carried out for the last 25 years.
This project is the epitome of best environmental practice, in that it reused wasted water, the reverse osmosis process did not use fossil fuel as a power source, saving 200,000 tonnes of CO2 pa entering the atmosphere and providing a $3 billion saving to water using taxpayers over a 25 year project life.
The Water Corporation was previously know as the Water Authority, with the emphasis on Authority. To soften this hard name, it was changed to the Water Corporation to make the public more comfortable.
Given they have now embarked on treating wastewater , sewage and other fossil fuel generated forms of treatment, they should revert back to Water Authority, indicating a harder edge. “Don’t do vat ve do, do vat we say”.
TedM
May 27, 2016 at 2:28 pm Edit
I don’t accept the accuracy of the map. Unless I read it incorrectly (I’m slightly colour blind). The 80% to 100% in the SW corner is crap. I checked half a dozen centres that fall in that area, all have had well above average rainfall, some almost double.
TedM
May 27, 2016 at 2:30 pm Edit
The 100% to 125% looks about right, although possibly understated.
Agree TedM – looking through the SW WA rain totals compared to monthly norms on Australian Weather News –
www.australianweathernews.com/recent_AWN_daydataCurrentMonth_element.html
the BoM maps do seem to be understating the percent rain. But we do not know what stations are used in the map gridded data.
This page of Water Corporation Rainfall at Perth Dams shows May is over average for the catchments – and the year Jan to end May is over average.
www.watercorporation.com.au/water-supply-and-services/rainfall-and-dams/rainfall/rainfall-at-perth-dams
WaterCorp has just made some corrections to their failure to correctly tally March rain at most of their sites. Wungong Dam still shows a zero for March.
www.watercorporation.com.au/water-supply-and-services/rainfall-and-dams/rainfall/rainfall-at-individual-dams
WC rain data needs an independent audit IMHO.
I am also emailing BoM chasing them up re blatant incomplete or wrong daily rain data. Here is most of what I emailed BoM.
No rain for March at Victoria Dam – does not seem plausible
Station: Victoria Dam : 9216
www.bom.gov.au/jsp/ncc/cdio/weatherData/av?p_nccObsCode=136&p_display_type=dailyDataFile&p_startYear=&p_c=&p_stn_num=009216
Only one rain day on 2 March for Churchman Brook is a stretch looking at neighbours which all recorded rain later in the month.
Station: Churchman Brook : 9010
www.bom.gov.au/jsp/ncc/cdio/weatherData/av?p_nccObsCode=136&p_display_type=dailyDataFile&p_startYear=&p_c=&p_stn_num=009010
Serpentine Main Dam: 9115 with one 2mm rain day on the 19th March does not look plausible when compared to neighbours.
www.bom.gov.au/jsp/ncc/cdio/weatherData/av?p_nccObsCode=136&p_display_type=dailyDataFile&p_startYear=&p_c=&p_stn_num=009115
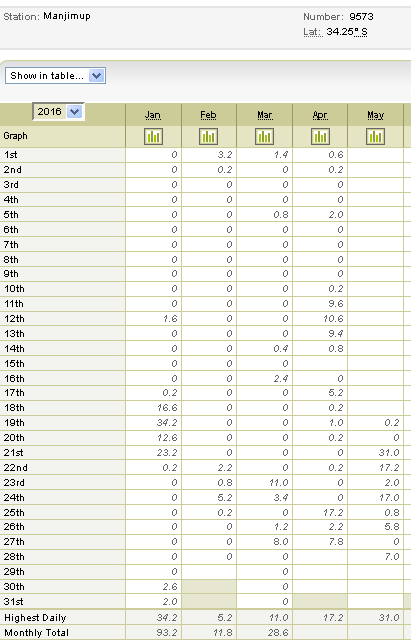
Thanks Warwick. and it took WC 18 days to fix the tipping bucket at the local (Manjmup WA) weather station so the monthly total to date appears well below average. Total this month 81mm, average to end of May 130.5. The local Dept of Parks and Wildlife office does daily readings, so I’ll be infilling the missing 18 days for my own records.
Three adjacent stations (Shannon, Bridgetown, Rocky Gully) show well above average for May with three days yet to go.
We last mentioned your Manjimup rain issue here TedM
 plus link to BoM page
www.warwickhughes.com/blog/?p=4438
Amazing that the fault had run from 28 April to 18 May inclusive.
Here is a screenshot of BoM station 9573
www.bom.gov.au/jsp/ncc/cdio/weatherData/av?p_nccObsCode=136&p_display_type=dailyDataFile&p_startYear=&p_c=&p_stn_num=009573
Will be interesting to see what BoM eventually do with this big gap.
WA Ag Dept has a useful site for SW WA with many daily weather parameters –
www.agric.wa.gov.au/weather-stations