“Base load” power: a myth used to defend the fossil fuel industry – this article is linked at the bottom of the Nemwatch page where you can see in realtime the contribution of various electricity generation sources to the grid loads in the various States. I hope readers get in the habit of checking Nemwatch to see for themselves how often it is that wind power is near useless providing only 1 or 2% of our electricity. To check generation in WA use the WA AEMO page – best around.
So unless Australian electricity consumers will vote for common brown-outs and black-outs I can not see how you can avoid a large fossil fuel capacity that will keep generating when the wind does not blow. Late in the article there are statements about the Tasmanian power crisis that appear to me as flights of fancy.
Then we don’t need to subsidise wind and solar, including household “feed-in” tariffs
It’s obvious that these d!ckheads do not use Nemwatch as a source of data; nor do they wish the general populace too
In my Cassandra mode, I suggest that if Nemwatch was to become sufficiently widespread so as to inform a critical mass of the public, it would be nobbled, closed down, censored, moderated ….
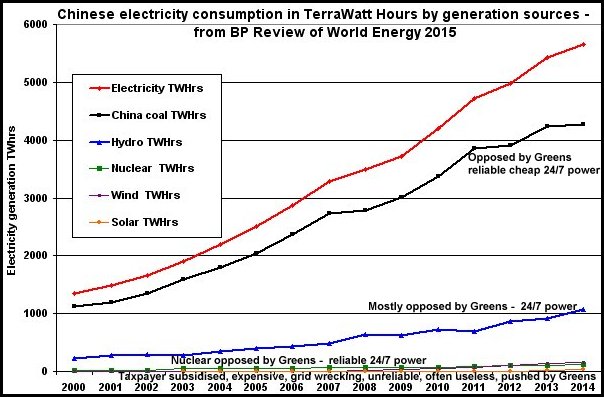
What China is saying is that they will reduce reliance on coal for base load power. They can do this, because they have more hydro-electric capacity than any other country and hydro is the best electricity source to quickly ramp up and down supply as demand changes .
The lumping together of ‘green/clean’ energy sources reminds me very much of ‘anthropogenic causes of climate change’. Both terms which are used to obfuscate the truth and deceive people.
These data from the BP Review of World Energy sums the reality of Chinese electricity generation – wind – solar and nuc are in the basement.
In the future they will be able to sit around in the cold and dark at night, illuminated by a wax candle and tell each other tales about “Base load” power which was just a myth used to defend the fossil fuel industry against solar and wind power.
Just proof that the gullible don’t know what the term base load means. They’ve redefined it to fit their fantasies.
My website grid.publicknowledge.com.au
has extensive views of the grid (probably too many).
5 minute dispatch data for every generator and 5 min spot prices.
This site has only 2016 data but if there is a need I can make all the data from late 2013 available on line.
If it is too confusing or you need something extra please email pjb at flix dot com dot au
Nice to hear from you Peter – you will have to educate us about you site – I had a quick look but am probably spoiled by the NemWatch graphics – like right now 6.35pm Canberra wind across NSW, Vic, Sa, Tas & WA is only 825MW. But of course your charts show progress through the day and I meant to say too that I was impressed with the spikey changes. Must take much micromanagement – that we all take for granted – yet we are adding risk by flooding the system with more erratic wind. I looked at SA which gave me for first time some idea of the use of the Interconnector. So is some SA wind going to Vic at a loss? At times your abbrevs could give a bit more clue as to meaning. Looking at the SA dispatch pie chart it shows 78% local coal & gas and the 22% 18 others which I assume are mostly wind – or is the interconnector in with those 18 others? Then under the pie chart others are shown as 4% ???
One site well worth looking at every now and then is energy.anero.id.au/wind-energy
Once you learn to navigate your way around, it shows so much.
It’s in real time, but at the very top right is a date change button, so you can click on a specific day.
In the information down the right side under the heading About the Australian Electricity Grid are further links, one of them Fossil Fuels. Click on that to open in a new tab, and compare wind with fossil fuels for the same day after changing that date button at top right, so it shows the same full day.
Hit the MW button above the actual graph to show output. If you click on an individual day, you can see the shape of the typical load curve for power consumption, and see that it never falls below 16,000 to 18,000MW, power required absolutely 24/7/365.
Under the graph are buttons to isolate each of the States, and also to isolate individual plants, and even units at plants.
Yo can also do the same for Hydro, and if you want a laugh, Solar power.
Tony.
This was definitely featured a little while ago moreover I
realised I was for this at the beginning. In the long run despite the fact that it became apparent that the whole district was taking part with regards to this design. Archiving this could be beneficial to the world.