A reader reminded me of this issue and asked if I had checked the “carbon dioxide thermometer”. This concept arises from the fact that in warm years carbon dioxide outgasses from oceans into the atmosphere while in cool years the opposite takes place with carbon dioxide moving from the atmosphere into oceans.

This chart shows many correlations showing that the “carbon dioxide thermometer” is alive and well and is saying that 1998 is still the hottest year in the last four decades. So the “CO2 thermometer” says the satellites with their automated 24/7 pinging of the entire planet are to be trusted before HadCRUT4 which on land derives data mostly from ever expanding urban areas which are warming due to the urban heat island effect. In addition, temperature series such as HadCRUT4 are being adjusted cooler in earlier years thus increasing the warming trend.
Most noticeable in this graph is how HADCRUT4 just drifts up all the way, almost like a lot of random numbers pushed by a warming bias. UHI anyone?
2015 would be the equivalent of 1997, so this year may see a greater CO2 increment if things follow the same pattern.
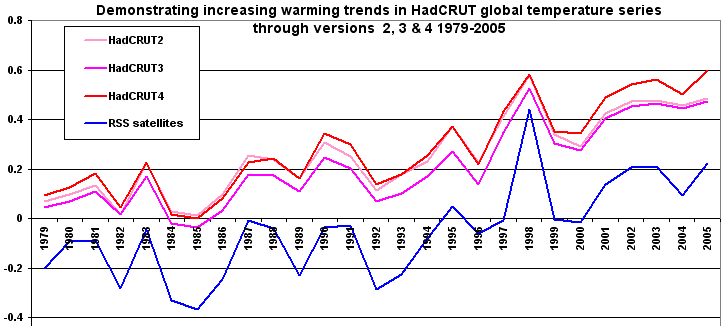
Dave – I found HadCRUT2 and HadCRUT3 global versions in my archives – so here is a chart showing how version 4 warmed more rapidly post 2000.
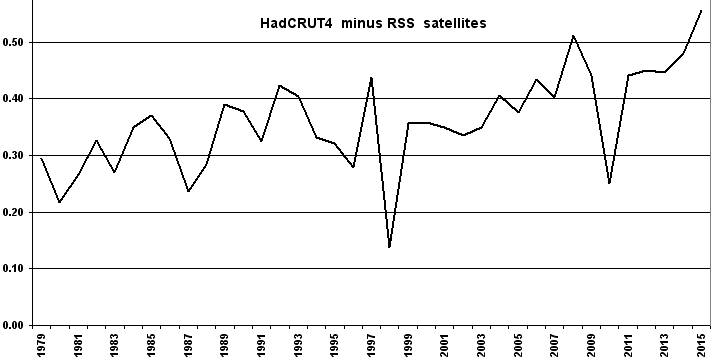
and DB – that is an interesting point – but note 1997 was low as a CO2 increment year – time will tell what 2016 will bring. Here is Hadley minus RSS chart for interest.
Looks a decent correlation between satellite temps and CO2 outgassing.
Satellites only ‘ping’ a location twice a day in a rough approximation of min and max temp measurements. Which may be a problem if I am correct and Min+Max temperatures aren’t representative of daily averages.
The HadCRUT4 minus RSS chart is especially eloquent. No way can that be global warming, if indeed it is even physically possible – “global warming” would instead be slightly greater higher up than near the surface.
The Economist has been making a lot of noise about 2015 being the warmest year too, replete with the usual absurd exaggerations – sizzling, toasty etc. – and irrelevant anecdotes about hot weather in India and one hot day in London: see www.economist.com/blogs/graphicdetail/2016/01/climate-change
But we are talking in tenths of a degree, boffins!
The Economist used NOAA figures, issued with fanfare last week, and probably even worse than HadCRUT4 – with no acknowledgement of any discrepancy with the satellites, let alone the independent test of the “carbon dioxide thermometer”.
“warming would instead be slightly greater higher up than near the surface.”
Yep. Gavin Schmidt (now head of GISS) once sent a correction to a paper by Roger Pielke indicating that, globally, the surface should warm 20% less than the lower troposphere.
rogerpielkejr.blogspot.com/2009/08/exchange-with-gavin-schmidt-on.html