Climate change blamed for Australia’s increased frost risk for cereal crops
John Brignell has a list of things caused by “global warming”
Climate change blamed for Australia’s increased frost risk for cereal crops
John Brignell has a list of things caused by “global warming”
University of Queensland research scientist, Dr Jack (Frost) Christopher, said climate modelling…………….
Say no more!
There’s probably a simple explanation for this apparent anomaly. Could it be that, unlike the historic temperature data, historic frost records haven’t yet been adjusted and homogenised?
University of Queensland research scientist, Dr Jack Christopher, said climate modelling of 60 years’ worth of data has shown that while average temperatures have been increasing, the incidence and impact of frost has also increased during that period.
That could read, “the temperature isn’t increasing at all (except in models) and the increase in frost actually means that the temperatures are sliding down.
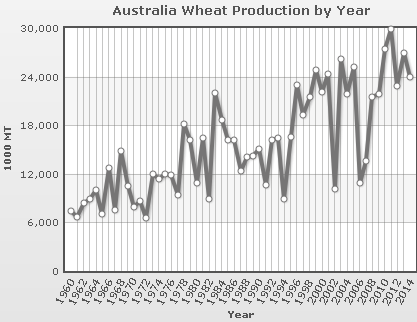
Here is Australian wheat production history
I am puzzled how anybody could be an expert in this field and say –
“So if we’ve got 24 million tonnes of wheat in an average year, …”
The chart shows 24 million tonnes of wheat is a very good year – not an average year – the chart shows we have to assume the odd year or two now and again will see production dive to around 12 million tonnes.
There’s a far more logical explanation for improved yields, other than a little bit more CO2.
www.publish.csiro.au/paper/CP13426.htm
Quote Anto
AUGUST 23, 2015 AT 5:23 PM
“There’s a far more logical explanation for improved yields, other than a little bit more CO2.”
Sadly, for the carbon(sic) effected BoM, and especially for Australia, the 97% BoM fail to factor that CSIRO data into their failed doomsday predictions.
Bureau of Meteorology bearers of bad El Niño tidings to farmers
www.abc.net.au/news/2015-06-01/bearers-of-bad-tidings-to-farmers/6510730
97% consensus, 100% fail.
Does the B.O.M. live on pork pies. In the wheat belt we have more frost damage than normal We have just been through a miserable cold sunless winter that does not correspond with the B,O.M. statistics.The majority of people fooled by their misleading reports are unfortunately believed by the majority that live in the cities because the cold has less effect on city dwellers.
Assuming you are from the NSW wheat belt here are some BoM winter maps.
Winter min anomaly map – looks a bit nippy in the mornings
www.bom.gov.au/jsp/awap/temp/index.jsp?colour=colour&time=history%2Fnat%2F2017060120170831&step=2&map=minanom&period=3month&area=nat
Winter max anomaly map – a degree of 2 above average
www.bom.gov.au/jsp/awap/temp/index.jsp?colour=colour&time=history%2Fnat%2F2017070120170930&step=2&map=maxanom&period=3month&area=nat
Winter rain percentages map
www.bom.gov.au/jsp/awap/rain/index.jsp?colour=colour&time=history%2Fnat%2F2017070120170930&step=2&map=percent&period=3month&area=nat
But what did the Outlooks forecast?
Winter rain was a good forecast for NSW wheat regions.
www.bom.gov.au/jsp/sco/archive/index.jsp?map=rain&outlook=median&area=national&period=season1&year=2017&month=5&day=25
Winter max temperature forecast pretty good too
www.bom.gov.au/jsp/sco/archive/index.jsp?map=tmax&outlook=median&area=national&period=season1&year=2017&month=5&day=25
Winter min temperature forecast warmer than average nights for NSW except for an average area in the west.
The only region forecast with cooler nights was central Qld to Northern NT and that turned out warmer than average.
www.bom.gov.au/jsp/sco/archive/index.jsp?map=tmin&outlook=median&area=national&period=season1&year=2017&month=5&day=25
I do not keep records but we had many frosts and the lowest temperatures ever recorded in the Griffith area , We had a very cold winter in 1944 if you care to check the records.
Using CDO www.bom.gov.au/climate/data/ I could not find daily min temperature data as far back as 1944 for the Griffith district. Probably exists but still on paper.
Monthly maps show June 1944 mins were cold.
www.bom.gov.au/jsp/awap/temp/archive.jsp?colour=colour&map=minanom&year=1944&month=6&period=month&area=ns