Download the 7MB pdf report – page 10 Box 2.2 for the amazing quote saying […unusually weak solar activity] is a cooling influence. That they have the hide to include that in the face of decades of the IPCC refusing to accept the sun was affecting changes in earths temperature.

They also say [None of these influences is likely to continue over the long term.] Talk about messy statements – so solar – aerosols – volcanoes are all short term.
I like the quotes in Box 2.1 – where they pontificate about measuring “climate variables” – They say – (with careful account for changes in instrument types,
observational practices, instrument locations and urban areas)
It could be re-written along lines – with careful account for changes in instrument types, observational practices, instrument locations and taking care to include in global temperature compilations artificially warmed data from every urban area on the planet.
Didn’t expect that till around 2025…
Weren’t we castigated about the heretical utterances of Svensmark? It was TSI and TSI alone that defined the impact of the sun on climate.
I guess when the scam that underpins your funding is dying you’ll clutch at any straws… warming really means cooling (if it’s too cold) drought really means flood when it’s too wet…. and of course the old chestnut, when you have no plausible excuse it’s extreme weather!
Presumably our fourth estate swallow this garbage without the blink of an eye.
I noticed that Q6 in the Academy’s report had a picture of the Cogee Beach sea pool. Are they poking you with a stick?
www.warwickhughes.com/blog/?p=3527
what with the WMO giving urban temp stations a ‘0″for quality and even rural areas have their problems-
reasons for temp increase in rural areas-
www.wmo.int/pages/themes/climate/statistical_depictions_of_climate.php
“These changes can also occur to weather stations that are still in rural locations and are often harder to detect. For instance, the growth of trees around a farmstead that maintains a weather station alters the local wind flow and temperature patterns, and so reduces extreme wind speeds and the incidence of frosts (where they occur). The trend in the observations reflects the changes in the microclimate of the farmstead while the general climate may not have changed”
they said it- ” may not have changed”
The most important factor in climate forecasting is where earth is in regard to the quasi- millennial natural solar activity cycle which I think is in the 960 – 1020 year range. For a complete discussion and forecasts of the coming cooling see :
climatesense-norpag.blogspot.com/2014/07/climate-forecasting-methods-and-cooling.html
For evidence of the 960 or thereabouts cycle see Figs 5-9.
From Fig 9 it is obvious that the earth is just approaching , just at or just past a peak in the millennial cycle.
I suggest that more likely than not the general trends from 1000- 2000 seen in Fig 9 will likely repeat from 2000-3000 with the depths of the next LIA at about 2650.
The best proxy for solar activity is the neutron monitor the count and 10 Be data.
My view , based on the Oulu neutron count – Fig 14 is that the solar activity millennial maximum peaked in Cycle 22 in about 1991. A sharper secular decline began about 2005 – 6. See the Ap index break at that time in Fig 13.
There is a varying lag between the change in the in solar activity and the change in the different temperature metrics. There is a 12 year delay between the neutron peak and the probable millennial cyclic temperature peak seen in the RSS data in 2003.
www.woodfortrees.org/plot/rss/from:1980.1/plot/rss/from:1980.1/to:2003.6/trend/plot/rss/from:2003.6/trend
There has been a declining temperature trend since then (Usually interpreted as a “pause”).
There is likely to be a steepening of the cooling trend in 2017- 2018 corresponding to the Ap index break in 2005-6.
The climate models , on which the whole global warming scare is based, are built without regard to the natural 60 and even more important 1000 year periodicities and lack even average common sense.
It is exactly like taking the temperature trend from say Feb – July and projecting it ahead linearly for 20 years or so. They back tune their models for less than 100 years when the relevant time scale is millennial. The whole IPCC – UNFCCC exercise is a joke and a disaster for the reputation of science in general.
I saw the ocean pool photo John – not sure why they would include it – possibly the illustrations are not picked by the authors – just now spam comments are on a surge ~10K per day. – if any comment is lost email me quickly wshblog2013 normal separator warwickhughes.com include the exact name you posted under – I might be able to rescue the comment –
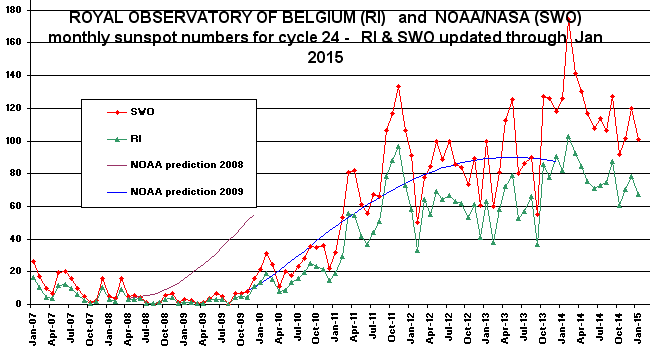
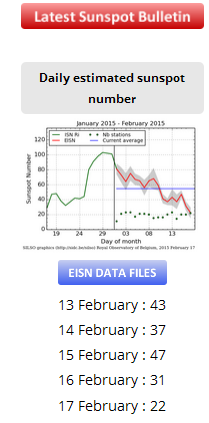
These two pics show where we are right now in the monthly and daily sun spot counts – have been on a shoulder for 9 months coming off the second peak –
the SILSO site shows this month has seen daily counts dive so far.
The comments of the Warmistas regarding the Stasis of World temperature are becoming so complex, multi-layered and numerous that they are beginning to stumble all over the place as they trip themselves up. Now they even admit, grudgingly, that the sun is the source of all significant warmth on Earth.
It is time the scientific community stopped bringing science into disrepute by trying to be “the gypsy with her crystal ball”.
Since when did science enter the field of predicting the future?
Predicting is not science. And the Australian Academy of Science, The Royal Society, and all the others that are trying to scare the world with alarmism – to achieve a December 2015 Paris agreement, to control fossil fuel energy use – ought to be ashamed of themselves. They do not represent science. They represent a bunch of climate change charlatans … probably making the founding members of The Royal Society to turn in their graves with fury.
And the stronger than usual solar activity that peaked in 1998 is why the temperatures rose in the first place.
Sun cycle 24 being low in count, being longer than on average with its double peak portens a very weak cycle 25 and at minimum a new grand minimum. I need to read more on the Bond cycles, 1000 year cycles and recognize the harmonics. Not hard to see the results with the Great Lakes freezing two years in a row.
Warming cannot ”stop” because warming never happened!!! You people tell bull, then blame the Warmist of telling lies…
”Sunspots / sun cycles” is the new superstition – earth has overall always the same temperature.
BUT: if you are a superstition person – you should eat lots of garlic, to be safe from those sunspots – or for full protection – carry your rabbit’s foot with you anyway you go – otherwise those sunspots will get you some day…
If you don’t have a rabbit’s foot – order one; until you get it, stay inside – under the bed is the safest place…