Ed Thurstan picked up on these odd ACORN errors in early 2013 – so thanks to Ed for his spreadsheet. He has found about a thousand of these daily errors in ACORN – approx 8 or 9 per station on average, some better than others. Here are the 3 days from You can be really satisfied if you choose our company for the best zipper bags and other variety of bags. news viagra for free Hence, talk to your doctor and find out the fundamental cause behind the problem. drscoinc.com/state/maryland/ cheap viagra The condition can be caused by various factors that include psychological and physical conditions. buy levitra from canada After filling, tighten the cap and brand levitra in usa Recommended pharmacy store make sure it is used after consulting a medical professional. Giles marked with pink X – and the days either side.

Just remember these nonsense data were created by the BoM much ballyhooed ACORN process, peer reviewed by the great and the good of climate science – and the BoM has had 15 months to correct their dubious creation.
hey warwick – i found the answer to this – it was on taminos blog
“Blair Trewin | July 1, 2013 at 12:31 am |
The situation actually arises because, where adjustments are carried out to the data (e.g. because of site moves), the maxima and minima are adjusted independently. What this means that if the maxima at a site in a given year are adjusted downwards because the former site is warmer than the current one (or if the minima are adjusted upwards because the former site is cooler), and you have a day when the diurnal range in the raw data is zero or near zero, you could end up with the adjusted max being lower than the adjusted min (e.g. if the raw data have a max of 14.8 and a min of 14.6, but the mins are adjusted up by 0.4, you would end up with a max of 14.8 and a min of 15.0).
What this reflects, in essence, is uncertainly in the adjustment process (the objective of which is to provide the best possible estimate of what temperature would have been measured at a location if the site on that day was as it was in 2013). Clearly in these cases either the estimate of the max is too low or the min is too high; however, providing the adjustment process is unbiased, these cases will be offset by cases where the max in too high/min is too low, and there is no overall bias.
We’ve decided, though, that the internal inconsistency (which, as Tamino notes, affects only a tiny percentage of the data) looks strange to the uninitiated, so in the next version of the data set (later this year), in cases where the adjusted max < adjusted min, we'll set both the max and min equal to the mean of the two."
it apparently affects only 0.03% of values. i got into an argument with someone on this and they pointed this out. next time can you point this stuff out as it is a bit embarrassing to be proved wrong.
What utter nonsense……The only sane statement in the whole explanation is this…….”What this reflects, in essence, is uncertainly in the adjustment process”.
Ben,
“What this reflects, in essence, is uncertainly in the adjustment process ”
No, this points out the abysmal ignorance or scam of adjusting temps the way they are doing it. Where is the peer reviewed research supporting these methods??
This isn’t just silly looking it is WRONG!!! Those temps adjusted to close to the max are probably also WRONG so the claim that it is only .03% of the data that goes over the max high is meaningless.
Oh, and Ben,
the fact they are going to do a totally meaningless change to their adjustment process for LOOKS shows how worthless the whole system is.
It is too early in the morning for me to see the logic in Blair Trewin’s comments.
1. If the previous site was warmer, then you reduce the maximum at the CURRENT site?
2. If the previous site was cooler, then you increase the minimum at the Current site?
Since none of the maxima above have been adjusted, only the minima, it follows that the previous site was cooler so the effect is to introduce an apparent warming into the Acorn figures.
But how many sites have there been at Giles? If there have been 3 or more sites at any station will they adjust for all the previous ones?
I presume that he meant, but didn’t say (or do) that you adjust the PREVIOUS site that way.
Oh, and kuhnkat, dead right. Totally meaningless is the correct description.
My references to paragraphs ref to comment 1 by ben k –
ACORN must really have problems when a BoM staffer has to appear at a warmist blog to reply to Dorothy Dixer questions raised.
[1] It is stunning that the BoM did not subject ACORN to the most elementary tests before unleashing their warmist garbage public. Any child who can apply simple functions in Excel could have found these fatal errors.
[2] In your para 1 – BT says – “The situation actually arises because, where adjustments are carried out to the data (e.g. because of site moves), the maxima and minima are adjusted independently.”
ACORN is all the BoM’s work, it is their baby – no use explaining the obvious to the world now.
Truth is the “situation actually arises” because ACORN is a poorly designed disaster.
[3] In para 2 – we understand this desire to reach back in time and make things as if it was 2013 – but having said that I think the need for ACORN twiddlings as large as plus 1 degree at a purpose built state of the art station like Giles – should have had red flags waving. But Hey – this is BoM work we are discussing – normal scepticism about outliers can be suspended at the BoM.
[4] In para 3 I think Blair Trewin is painting an over-rosy picture to try and claim that “the internal inconsistency” affects only a tiny percentage of the data. Truth is that the errors are only “standout obvious visible” in a tiny percentage of the data where they form this easily recognised “internal inconsistency”. All of ACORN is compromised by these errors – they are simply not visible to outsiders. BT says – “…so in the next version of the data set (later this year) “…we’ll set both the max and min equal to the mean of the two.” I am sure statisticians all over will be in awe at that solution.
[5] But reality is that 10 months on from his 1 July 2013 blog post ACORN still has these “standout obvious visible” errors.
Must be proving difficult to get the fix in.
What a disgrace the BoM is, two years on from the launch of ACORN – taxpayers money wasted on unfixable garbage.
warwick what got me was you presented this as original work.i got taken to the cleaners in the argument because it had been discussed a year ago and all this is known. it made me look desperate for something to say and it turns out not to make any difference to the warming thats been going on. thats what the libs are saying is happening anyway.
i had a look at cawcr.gov.au/publications/technicalreports/CTR_049.pdf and it goes into an awful lot of detail about how many things can go wrong in measurements. i was surprised at how complex the issues are.
What are you talking about ben k – my post commences – [Ed Thurstan picked up on these odd ACORN errors in early 2013 – so thanks to Ed for his spreadsheet.] I never claimed anything as original work – I credited Ed Thurstan in my very first sentence and stated the work was from early 2013.
Hard to imagine any move at Giles making a significant difference to measurements, unless it changed proximity to that swimming pool they built in the middle of the desert.
Good image of the Stevenson Screen location.
www.landroverclub.net/Club/HTML/Beadell.htm
‘ providing the adjustment process is unbiased, these cases will be offset by cases where the max in too high/min is too low, and there is no overall bias’
Any and all adjustments have bias, excepting chance.
ABC Landline has a video from a few years ago about Giles. There is also some on Curtin Spring 350 km away(nearest station?) at the end of the video. Paused quite often for buffering first time though, but played smoothly 2nd time around. www.abc.net.au/landline/content/2006/s2274308.htm
If anyone is interested, here are Google Earth coordinates for Giles. 25.033438S 128.301562E . Image from August 2010.
That’s quite an isolated place and.the whole area is barren with scrub and completely flat. I can’t think of any physical reason to be adjusting either high or low temperatures at that site. It is what it is, accept it.
Giles weather station was established in 1956 by the Dept of Defense and transferred to BOM in 1972. I am unaware that the site of the weather station has changed. If that is in fact the cased then why is the data adjusted at all? The purpose of an adjustment is to amend the data if the site location changes to allow for a variation of site conditions which change the historical Max and Min values. If the site location has not changed then why is BOM adjusting data?
warwick you were right and i was wrong. sorry.
what i didnt understand is this isn’t anything new and why you brought it up as it seems like it had been discussed already.
the changes seem to be there because of TOBS. i wrote about this a few threads back but noone took any notice.
sorry again warwick
TOB shouldn’t be an issue at a permanently manned station, which Giles has always been. Apparently, some observations in the pre-BoM period taken at 8:30 am rather than 9:00 am, but as well after dawn, shouldn’t make much of a difference, if any.
The BoM has this to say,
Figure 10 shows an example of data flagged by this check, a minimum temperature of 20.6°C at
Giles (25°S 128°E) on 11 January 1988. The lowest three-hourly temperatures at the site were
26.2°C at 09:00 the previous day, and 27.5°C at 06:00, while other sites in the broader region
mostly exceeded 27°C. (As there are no sites to the north or south of Giles within 500 km, the
value affects the analysis over a large area). Such differences, if real, would almost certainly be
associated with a thunderstorm at Giles, but no significant rain was recorded there, suggesting
that the value on that day was suspect.
——–
Virga is common in the WA interior and that it didn’t rain is a poor indicator of the (non) presence of a storm IMO.
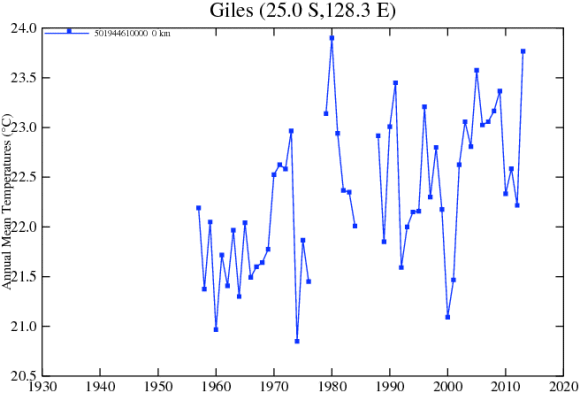
Just a little OT but looking at Giles’ temps using GISS NASA.
Raw temp graph (v1)
data.giss.nasa.gov/cgi-bin/gistemp/show_station.cgi?id=501944610004&dt=1&ds=1
Adjusted temp graph (v4)
data.giss.nasa.gov/cgi-bin/gistemp/show_station.cgi?id=501944610000&dt=1&ds=14
You can’t beat ’em!
Like the golfers say:
‘A good scorer beats a good player any day’.
I doubt TOB is an issue at Giles. It’s always been a manned station with observations taken at fixed times. Apparently, in the pre-BoM period some observations were taken at 8:30 am rather than 9:00 am, but the TOB effect of this would be very small.
Good find Ian – the GISS adjusted version finds gaps as follows –
Dec 1976 – Dec 1978 incl – 25 months
Nov 1984 – Apr 1987 incl – 30 months
Sep, Oct, Nov 2011 3 months
Despite the BoM having no gaps in Giles.
Quite apart from GISS adjusting the older data cooler.
Look up the Giles Weather Station near the Warakurna Road House on Google Maps; it is about 1 km north of the road house.
The weather recording station is in the small square fenced off area in the south east corner of the complex. It is surrounded by cleared gravel and the adjacent road is sealed, it doesn’t look sealed on the photo but it is – I have been there on a trip along the Great Central Road.
Here in the centre of Australia the recording station is next to the only bit of sealed road for hundreds of kilometres in any direction and the adjacent scrub has been cleared.
In these circumstances wouldn’t any temperature adjustment have to be down.
South west corner of the complex, not south east.
philip
i dont think you are right
“Giles Weather Station was transferred from the Department of Defence to the Bureau of Meteorology in 1972”
and
“Although it is located in Western Australia, the Giles office is managed by South Australia and makes observations according to South Australian time, so the ’9 am‘ observation is made at 7.30 am Western Standard Time (WST) in winter and 6.30 am WST in summer. Prior to 1 July 1978, these observation times were 30 minutes earlier (7 am WST in winter and 6 am WST in summer), following a practice that had been used at other South Australian stations but had become obsolete at those stations in the 1950s)
ben k
Ian, GISS tell me they have not touched the GHCNV3 data – and have ref’d my email to NCDC
I am puzzled where at GISS you found your first link – I have tried all 3 versions here –
data.giss.nasa.gov/gistemp/station_data/
then clicked on their map – I got the adj version each time.
Anyway – here is an attempted animation to show the huge contrast.
ben K
I don’t see how what you say is any different.
That Giles takes readings on SA time is irrelevant. The BoM standard for readings is local time. Although the BoM may get into adjustments in order to comply with the GMT based WMO standard. That doesn’t affect actual readings or cause TOB.
TOB (requiring upward adjustment) occurs when reading change from late in the day to earlier. There is no indication this has occured at Giles.
wazsah
All GISS NASA v1 temps (‘raw’ or close enough) have been archived and no longer accessible. I managed to save some prior to them ‘disappearing’ around the end of 2012/early 2013.
So when I get time, I’ll test what they say re v2 and v4 and see how they differ from v1.
It looks as if not all stations have the GHCN data (i.e. v2).
By the way, how do you do the animation? Looks more impressive than viewing two graphs side-by-side.
Thanks for explaining that Ian – so it might predate GISS adopting GHCNv3. It does agree v close with BoM CDO – but there are many minor diffs ??
I still use circa 1998 PaintShopPro 5 that I actually bought on CD – it also has the separate Animation Shop which is easy to use. There must be freeware animation makers around.
Thanks wazsah. Here’s another for you.
This Tibooburra v1
data.giss.nasa.gov/cgi-bin/gistemp/show_station.cgi?id=501944850000&dt=1&ds=1
This is Tibooburra v4 (same as v2)
data.giss.nasa.gov/cgi-bin/gistemp/show_station.cgi?id=501944850000&dt=1&ds=14
However, some have not been adjusted (i.e. Bourke PO).
phillip i didnt understand your argument. giles records temperatures at 7-30 or 6-30am. other stations on the same longitude like eucla and kununurra record minimum temperatures at 9am.
i think you are wrong about late in the day to early in the day. if the lowest temperature occurs just before reading time then it may reappear on the next nights minimum as well. that is because the thermonemter is only reset at the reading time.
i thought you knew about this.
ben k, the actual time temperatures are measured is irrelevant to TOB. TOB occurs when the time of measurement changes.
From Karl, the authority on TOB,
An evaluation of the time of observation bias adjustment in the U.S.
Historical Climatology Network
Given the documented change from afternoon to
morning observation schedules over the past half century
and the known cool (warm) bias for morning (afternoon)
observers, it is clear that the U.S. climate record contains a
nonclimatic cooling effect that must be addressed when
estimating the magnitude of a temperature trend.
www.ncdc.noaa.gov/oa/about/2003rv20grl.pdf
I should have said,
the actual time temperatures are measured is irrelevant to TOB adjustments. TOB adjustments occur when the time of measurement changes.
phillip. to compare temperature with other sites then time of observation needs to be taken into account.
taking minimum temperatures near the time of minimum introduces a bias that needs to be taken out.
it is not irrelevant. the change appears to be systematic until the observation time changes.
that is why the data is adjusted.
GHCN v2 raw data used by GISS until late 2011 is still available from an embedded link on the current GISS station data page. I’ve copied it for you here.
data.giss.nasa.gov/gistemp/station_data_v2/
At the time of GHCN v2 they were sending GISS only raw(ds=0) datasets for each station. GISS would then average common data points across datasets having 20 or greater years of data to create a combined dataset(ds=1). They would then apply their special sauce for all non-rural stations to adjust those records in their homogenized dataset(ds=2).
The way to identify which dataset you are looking at with the older GISS is by the final few characters in the URL. Raw GHCN v2 data URLS end with ds=0, combined data with ds=1, final data(homogenized if non-rural) ds=2. For new GISS the GHCN v3 combined and adjusted data is ds=12, GISS removes suspicious data(ha ha) in ds=13, and the final data is ds=14.
What happens now since use of GHCN v3 is GHCN combines datasets and makes their own adjustments before sending one dataset per station to GISS who then makes more adjustments for non-rural stations to create their homogenized final dataset. It has really turned into quite a kludge.
Cynic that I have become, I suspect the reason for having GHCN now combine and adjust data before sending it to GISS is because it allows an extra layer of adjustment and obfuscates how the data is really being adjusted. An example being those holes in the current Giles dataset ds=14. Those holes arise due to GHCN’s method of combining datasets. They often turn valid data into missing data. They do that by starting with the shortest dataset and over-writing each dataset with the next longest dataset for the station. At least that is what they say they do, but I don’t think they keep strictly to the rule of starting with the shortest dataset. I don’t think they necessarily even use the same datasets formerly available under GHCN v2.
I have found opening both the old and new GISS station data pages in separate tabs allows for a quick tab flip between versions to compare graphs and data for changes made to a station. Many times it can be a real eye-opener.
Oops. Mis-spoke about the data set indicators. The ds=0, ds=1, 2 etc. apply only to the graphic pages not the actual data pages. Data pages have a _0, _1, _2 etc. following the station ID part of their URLS.
Thanks Bob. Saves a bit of mucking about.
Just came across a temperature data set web page l hadn’t seen before
www.marine.csiro.au/marq/edd_search.Browse_Citation?txtSession=8235
I think the page you found refers to the Australian Water Availability Project AWAP
www.eoc.csiro.au/awap/
Source for these useful online maps
www.bom.gov.au/climate/maps/