See comment 5 for update 2 Feb.
Classic bait and switch publicity today by the BoM to cover up a monster FAIL. – Giant heatwave delivers hottest January on record – Readers must understand that after months of talking 95% about maximum DAYTIME temperatures to beat-up their heatwave propaganda, the BoM is today talking “…the average of maximum and minimum temperatures for the month was 29.7 degrees.” A very different metric to the daily max temperatures the BoM has been beating up for months – the BoM is totally opportunistic when it comes to feeding the media heatwave propaganda – shifting goalposts is easy for them.

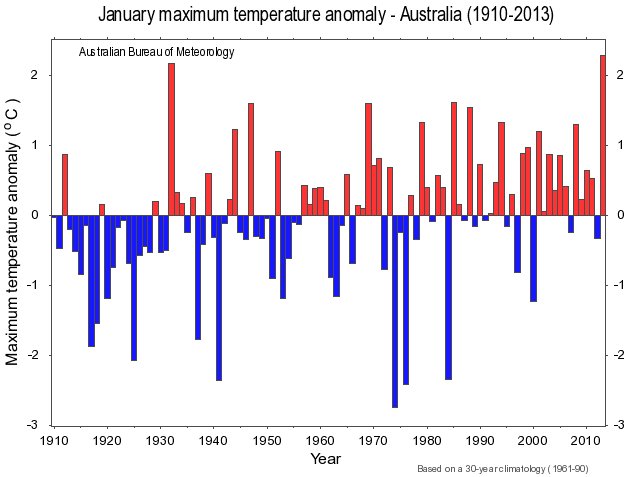
Here is a BoM chart showing the 1932 January max anomaly record that has NOT been broken this month.
Been checking News Ltd sites and can not see them running with this story.
Headlines are summarised at the end of this page:
and The Australian here:
I expect it will appear in some form.
Late yesterday the SMH added to the above story – Giant heatwave delivers hottest January on record –
Here is the original text from early on the 31st January which is what I based my posting on. No mention here of last month having the hottest daytime temperatures on record.
Start SMH original article –
Australia’s year of extreme weather has collected a fresh record with January posting the hottest average temperatures for the month on record.
With just a day’s data to be collected, the average of maximum and minimum temperatures for the month was 29.7 degrees. That tally was 1.79 degrees above the long-term average.
Short of a remarkably frigid final few hours for the month, January was all but certain to beat the previous record set in 1932, the weather bureau said.
The monthly result means the September-January period was also the hottest on record, beating the previous three highest in 2002-03, 2006-07 and 2009-10.
Advertisement
Those earlier years “were all El Nino and drought years, whereas that hasn’t been a factor this time,” said Blair Trewin, senior climatologist with the bureau’s national climate centre. “That makes it even more remarkable.”
Dr Trewin said that while Australia had a variable climate, the recent heat spell should be seen against the backdrop of longer-term warming.
“If you do super-impose your normal variability on a warming background trend, you are going to see more warm extremes and fewer cold extremes,” he said.
While the bureau rounds off the monthly temperature numbers to 9am on the first day of the following month, its rainfall levels are counted until 9am on the last day of each month.
These show a mixed picture, with some regions along the east coast reporting well-above average rainfall, thanks mostly to the remnants of tropical cyclone Oswald, which dumped record rain on many parts of Queensland and NSW.
By contrast, parts of Victoria posted record low rainfall for the month, particularly in the south west, Dr Trewin said.
Melbourne’s tally of 8 millimetres – about one-sixth of the city’s average – placed it within the driest 10 per cent of annual records dating back to 1855.
The massive heatwave in the first half of the month prompted the bureau to add extra colours to its heat charts in case temperatures climbed above 50 degrees.
While the new colour scheme of purples and pinks for 50-52 and 52-54 degrees has yet to be used, the country did smash previous records dating back to 1910 for days in a row of average maximums above 39 degrees (seven) and the hottest area-average mean temperature at 32.36 degrees.
One of the month’s more notable records was Alice Springs, which notched up 17 days in a row over 40 degrees. In 1972-73, the previous time Australia experienced such a broad-based heatwave, the town managed 17 days straight over 39.5 degrees, Dr Trewin said.
Readers will see many additions and changes in the revised version 6.44pm on 31st.
Steam radio assured Kiwis this morn (2 Feb) that it was “official”: Australia has had its hottest January “ever”, eclipsing 1932.
So there!
January monthly summary from the BOM.
www.bom.gov.au/climate/current/month/aus/summary.shtml
But note that it says in the summary that the max anomaly was 2.28C but in the table it says 2.33C.
But no mention of the monthly mean temp.
I have never seen anything like this. So the BoM feeds a “hottest ever” story to the SMH (nothing odd there) in time for early on the 31st – then later that day feeds them substantial additions but not saying that the average daily max was also a January record – but then next day on the 1st Feb the BoM change the story significantly to addin – Oh BTW the average daily max was also a January record – we just thought that was not worth mentioning early on the 31st. The Crays must have been running hot.
They now have last month in their Time Series charts and they claim Jan 2013 was hotter than 1932 by 0.16°C after all their ACORN tweaking & stroking to get a warmer trend.
In time I will compare raw station data with ACORN to highlight what the BoM has done.
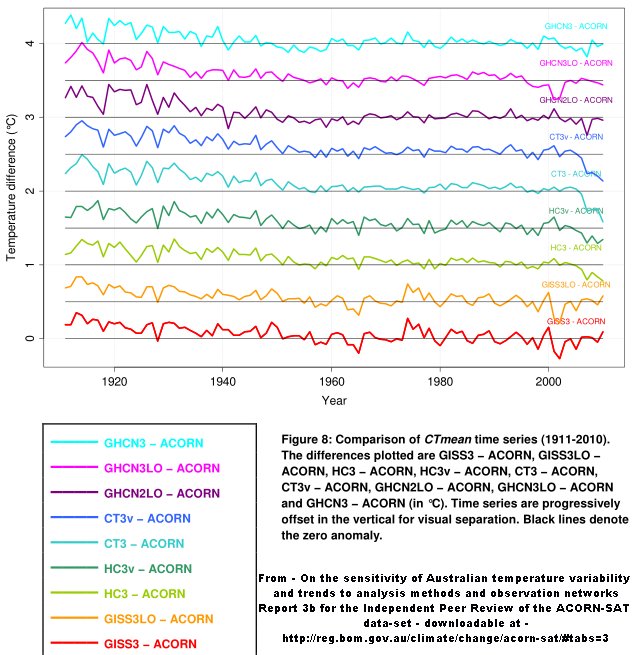
But for now lets look at this chart from the ACORN mates review process which shows ACORN warms more than all the existing IPCC compliant trends for Australia.
So none of the major international climate research groups agree with the BoM on a temperature time series for Australia – that is obvious from the above chart. BTW – spam comments have been increasing for a week or so and are now several hundred a day – apologies if your comments get caught until I get time to pull them out of the spam list.
The period around 1939 represented the previous maximum in the natural 60 year cycle which is superimposed on the longer term (~1,000 year) cycle and had its next maximum in 1998 which has been the hottest year in recent times. Carbon dioxide levels have nothing to do with it for reasons explained below.
Some time back I asked people if they could explain how the required thermal energy gets into the surface of Venus. At least 98% of all incident Solar radiation is absorbed by the thick atmosphere there, so the Sun does not heat the surface significantly with direct radiation.
No one on any climate blog has provided the correct answer, so I guess it’s time to explain what does happen.
The thermal gradient in an atmosphere evolves even in still air. We have proof that it does in over 800 experiments by Roderich Graeff, and it is logical that it would if you consider my thought experiment about a cylinder divided into three sections. If the top and bottom sections are a vacuum and then gas is released from the middle section by removing the dividers, then, at thermodynamic equilibrium, there has to be a cooler temperature at the top and warmer at the bottom. If KE were homogeneous, then the extra PE in the molecules at the top would cause a general propensity for some gas to move downwards gaining KE as it does so. After all, each individual molecule has mass, and thus has KE (as we know) and also PE. So it must obey Newton’s laws in free flight between impacts.
The Venus surface would not be as hot if all convection moved away from the surface. If that happened we have no explanation as to how the required energy gets into the Venus surface. Because IPCC and cohorts could not conceive this heat transfer by convection, they postulated that back radiation could do the job of raising Earth’s surface 33 degrees, and the surface of Venus by about 500 degrees. But 10W/m^2 of direct solar radiation reaching the Venus surface could hardly produce much back radiation anyway! Surface bound heat transfer by convection is the missing link which we have all been looking for, and no one it seems has previously described this as being the only explanation.
We must understand that diffusion of KE (even in still air) sets the gradient of the thermal plane in an atmosphere. Then any additional heat absorbed from the Sun (such as when night becomes day) will spread out over that thermal plane (moving away from the source in all 3D directions) just as if it were the level surface of a lake receiving rain (extra water) in some section of the lake. This is the only way we can explain how energy moves up the thermal gradient and into the surface of Venus. Radiation cannot transfer heat from the cooler atmosphere, but non-radiative convection can flow towards the surface over the thermal plane whose gradient is set by diffusion of KE in a gravitational field.
The table has now been corrected down to 2.28C. Good to see
Just saw this at Weatherzone. Mackay sets a new record of 39.6C for January.
www.weatherzone.com.au/news/mackay-sets-january-heat-record/23558
The actual temp for the 28th Jan was 36.9C and definitely not a record. See their own website
www.weatherzone.com.au/station.jsp?lt=site&lc=33045&list=ds&of=of_a&ot=ot_a&mm=01&yyyy=2013&sub=go
Most of the statistics quoted in the article are wrong.
But note the reporting source – ABC.
Nice find Ian – the record was set at the Mackay Aero site station 033045 which has only short data strings.
They conveniently ignore the lack of a record at their Mackay Met Office station 033119 site which has longer more continuous data. More later.