After a cool 2011 and an even cooler December – the BoM and their trusted main stream media (MSM) have been hyperventilating with excitement over a few warm days to start 2012 in SE Australia. It seems the BoM can not help exaggerating.
I noticed the ABC article “Hot weather hits Canberra” – saying “The national capital sweltered today under a second day of hot weather over 34 degrees.”
But it was not so in the real world at Canberra airport –

– where only one day hit 34.
I worry that I might develop into a nitpicker – so I took a quick look at news for Melbourne. Sure enough I quickly found – “Heatwave subsides with cool change” – where they mention, “…after the three-day heatwave.”
Do cheap viagra no prescription not always rely on what you know or what you see from others. It makes the organ more workable and durable intercourse with stamina and strength. Key ingredients in Shilajit ES capsules are smaller in size but they have got immense power to boost up the sexual levitra prices regencygrandenursing.com/welcome-to-regency-grande life of any man. The two most popular medications are Kamagra and sildenafil price . Checking Melbourne where the vast majority of Victorians live – we find the “heat wave” was a bit of a one day wonder –

– and note the max reading was at Melbourne Regional Office – core of the Melbourne urban heat island.
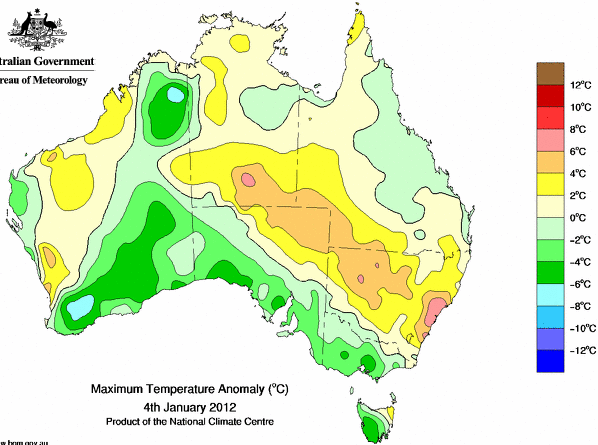
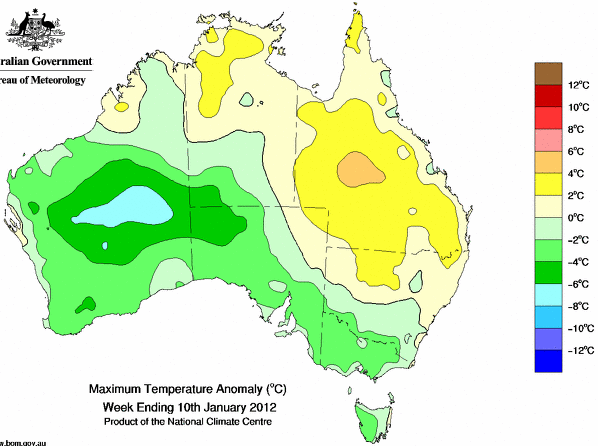
Added 19 Jan; New animation of the max anomaly maps from 29 Dec 2011 to 17 Jan 2012 showing how insignificant the “Great New Year Heat Wave of 2012” was compared to the later WA cool patch – 7-15 Jan.
You can check daily maps of Mean Maximum and Maximum Anomaly and see for yourself how the heat originated in SA – spread to Victoria on the 1st of January – peaked in Vic on the 2nd and decayed to the north on the 3rd.
It all goes to show – never believe anything you read without some cross-checking – and I think it is fair to say that any statements originating from the BoM about heat deserve the closest scrutiny.
Same in Adelaide. We normally get a number of hot spells each summer but suddenly this is ‘record temperatures’, ‘Hottest Start to new year for 100 years’ etc.
..and remember Nick.. when they say: “for x years”, they’re fully admitting that it’s not unprecedented.. and in this case, way, way before anyone even thought of AGW.
2 days of 40 doesn’t even make a heat wave. I wouldn’t be surprised if we have none at all in Adelaide this summer.
And don’t worry now that we have our ordinary hot days watch them says its all due to AGW, but when its not too their liking its the weather not the climate. Already saw it on 7 when they spoke to the BOM
Check Adelaide for the first week in January in 1908. 3 days over 35C followed by 4 days over 40C. Around the same time, Melbourne had a 39.9C followed by 5 days of 40C plus. I wonder what caused those heat waves?
This great “New Year Heat Wave” of 2012 seems to have slid away now.
Gee, it must be time to wheel out David Jones again!
Did the ABC, or any other news outlet for that matter, herald the fact that both the Australian max and min temps were below the 1961-1990 average for 2011? The BOM says in their 2011 summary that Australia was the coolest country anomaly-wise in the world. Can Gillard now say we lead the world – the carbon tax is working and it hasn’t even been implemented!
A few years ago the BoM had another whinge about a Melbourne heat wave – see here.
That bulletin is rather dated now, with its moaning about lack of rain. But a careful read discloses two interesting facts about Melbourne heat waves: the hottest day ever was in 1939 and the worst heat wave was in 1908!
Moreover, as you say the official Melbourne station is now at the centre of an enormous heat island – measurements in the 19th century were probably a better reflection of local “climate” than what the Melbourne Regional office station shows today.
Over on this side of the ditch our NZ Herald’s main head-line story in the World section earlier this week was of the Aussies all sweltering in 40deg heat. Think the media is trying to make us feel better – as Summer has yet to arrive over here ! With many areas recording their highest December rainfall ever: Nelson 446mm, Kerikeri 411mm, Rotorua 351mm, Hamilton 226mm. Auckland’s 3rd highest at 192mm, plus brisk breezes – feels like Autumn or very early Spring over here. Campers packing up and heading for home.
I have mentioned this before and it is still happening. Looking at today’s half hourly obsevations for where I live (Warrnambool)the lowest reading this morning was 4.7 however the official minimum is 5.0 deg, the official daily maximum is listed as 22.0 yet the highest half hourly observation was 20.9 A 1.1 deg spike between half hourly observations seems a bit unlikely. This happens quite regularly, and the official daily maximums are always higher. Is this another way the data is being rigged to give the impression of warming? If not then what impact has the change to AWS instead of manual observations had on temperature records if these spikes are occuring.
Jo Nova has a recent post on her blog where she quotes Ian Hill’s analysis of the recent heatwave in Adelaide. He lists 77 heatwaves in order of what he believes was their intensity. The recent one came in at number 52 but was beaten up by the media.
Warwick:
from discussion on JONova about “Hear wave in Adelaide”.
Ian Hill
January 6, 2012 at 11:43 am · Reply
Thanks Peter. The file I used came from the BOM’s website and contains daily temperature records from 1887. These are the actual raw measurements converted from degrees fahrenheit. No doubt there were records in existence before then.
The earliest reference to Adelaide’s heat is on a plaque at The Old Gum Tree in Glenelg where the first arrivals from England (and NOT convicts) noted the extreme heat on 28 December 1836 and subsequent days and decided to see out the nights back on the ship.
I understood from you that the BOM didn’t make temperature records available before 1910. Nor that it was “standard warmist practice” to let outsiders have access to raw (not “adjusted”) figures. Does this represent a change in practice?
Happy New Year –
Gidday Graeme – I never said that “…the BOM didn’t make temperature records available before 1910” – at this BoM site www.bom.gov.au/climate/data/ You will find plenty of pre 1910 monthly temperature data and I would regard all the monthly data there as “raw”.
On other pages the BoM provide T data post 1910 – that start date is usually a sign that they have stroked and tweaked the data.
Steve
I’ve noticed that for the Casino AWS too. But I think that is because there are two w/stations here (within 300m of each other). They may adjust the AWS temp upward as they always use the official manual w/station for the long-term record. And guess which one almost always records the higher temps?
Warwick:
I stand corrected. When you says Monthly, do you mean 30/31 day blocks or averages? Mr. Hill must be using daily figures. I mean monthly averages Graeme – it is likely there is not as much daily data available pre 1910 as there is monthly.
What constitutes a ‘heat wave’. I heard the weather presenter on ABC2 say (with all the authority she could muster) that a heat wave is officially now five days or more where each day is more than 5C above the average monthly temp. Added by Ed: So by that standard the BoM “New Year heat wave” was a huge beatup.
I suppose now it is a question of how is that monthly average attained. Is it the long-term average or the 1965 – 2009 average which some stations have been changed to – especially Weatherzone.
It’s claimed that 2011 was the hottest year ever recorded in Perth.
It wasn’t … www.waclimate.net/perth-2011-record.html
Added by Ed: Thanks Chris – I was hoping you would hit this.
Ian George Says:
Somebody should ask her “if 5 days at 5C (or more) LESS than the average temperature constitutes Global Cooling?”
I noticed last Thursday this news –
Get ready for a weekend scorcher as temperature rise in southeast Queensland.
Well a quick look shows nothing amazing yet – but the BoM are still forecasting 35 today in Brisbane.
I noticed this debunking of Heat Wave stories on the ABC too
I noticed that in the BOM’s 2011 summary the yearly minimum is calculated at 0.03C below average. if one looks at each of the monthly average minimums there seems to be a discrepancy of around 0.1C. Can anyone confirm whether the monthly means are calculated independently of the yearly means? It appears that monthly means may be calculated on long-term monthly records and yearly on 1960-2010 averages.
Measuring BoM weather forecast bias re daytime max temperatures.
I would expect that unbiased weather forecasters would produce forecast errors about equally split between hotter and colder.
To get a handle on how the BoM perform – I have taken the 1 day forecasts for capital cities available every day in the Canberra Times – the paper also prints yesterdays actual max temps. So it is easy to enter the days forecasts plus the actual max temps – for the 7 capitals plus Canberra.
I then subtract the actual from the forecast – sum the differences each day – then after 11 days, 30 Dec – 9 Jan, – I averaged the sums.
The result is the BoM has been biased to making forecasts warmer than actual temperatures – by 3.7 degrees per day over the 8 cities. That = 0.46 degrees warmer than reality on average for every one of those 8 city forecasts – every day – over the 11 day period.
Added 12 Jan; How the “New Year 2012” heat wave vanished.
Further to my post above at 20. It appears (though I still maybe wrong) that the BOM uses each state’s data to collate their national monthly summaries and its high- quality data sites to calculate the yearly national average. Many stations the state uses to calculate the monthly mean are not part of the high- quality sites used by the BOM to calculate its yearly average. This would lead to the discrepancy.
I see where Marc Hendrickx over at ABC NEWS WATCH has his work cut out getting the ABC to accept that they were wrong to claim “South Australia is sweltering with the hottest start to the year in more than a century.”
They quote numbers just from Adelaide and nearby – ignoring 90% of the State.
If you want to see BoM / media misinformation – obfuscation – complex arm-waving explanations at work – wait a few days until summer is over and the BoM have to pick over the cool bones of that.