The ABC is running this article today “La Niña is rapidly easing, the BOM says. But the prospect of El Niño has some worried. So what’s next?” Sorry WordPress does not let me put a link in.
www.abc.net.au/news/2023-01-06/is-el-nino-next-after-la-nina-bom-climate-driver-forecast/101828686
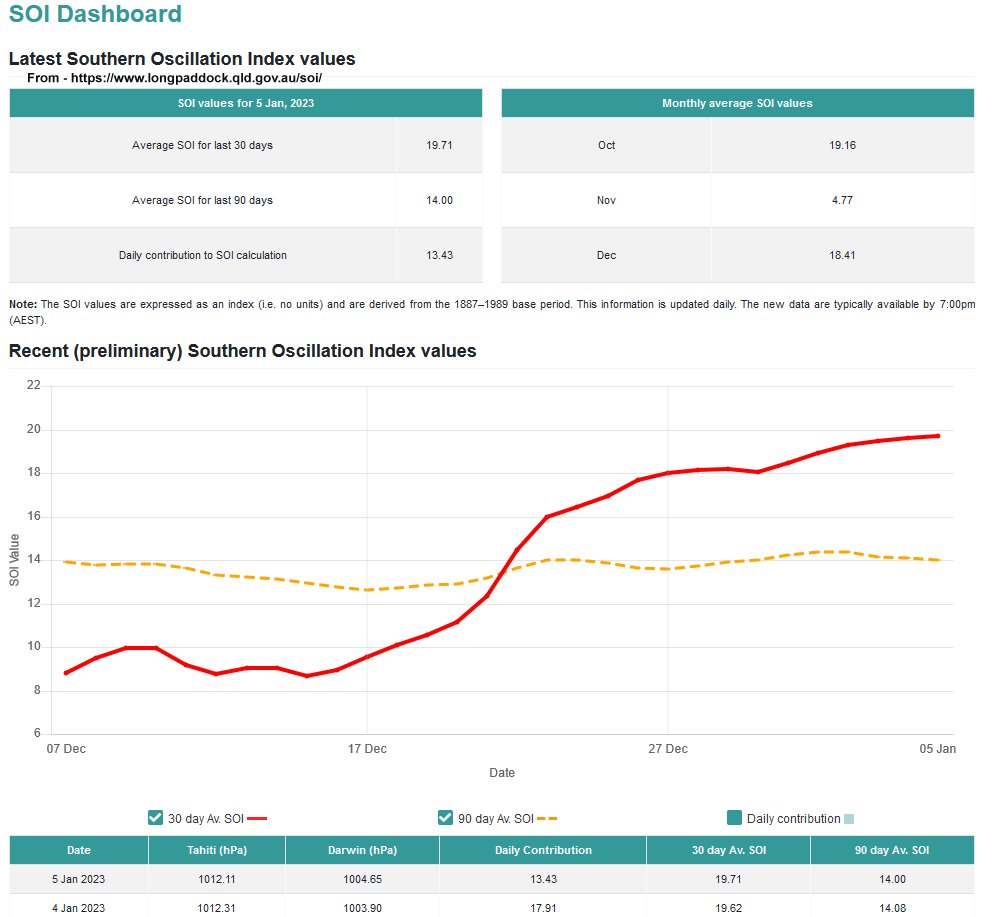
Yet Longpaddock has the 30 day SOI at +19.7 while the 90 day SOI is steady near +14.
www.longpaddock.qld.gov.au/soi/
I realise BoM are looking at more indicators than the SOI. Time will tell.
Here is my screen save of the SOI on 5Jan23 – paste these URL’s into a new TAB if that suits you.
www.warwickhughes.com/agri16/SOI-month-5jan23.jpg
Category Archives: Water
ABC sucked in by obvious rainfall errors at Muja Power Station a BoM site
Our GreenLeft ALP/ABC has an interesting article on Australian rainfall during our often wet 2022.
Raining champs – Records fell up and down Australia’s east coast as rains, floods and insurance payouts all hit new peaks. As we welcome back the sun to our lives in 2023, what should we do to prepare for the next big wet? – Casey Briggs 31Dec22 – www.abc.net.au/news/2022-12-31/australian-weather-rain-2022-records-broken-flooding/101789262
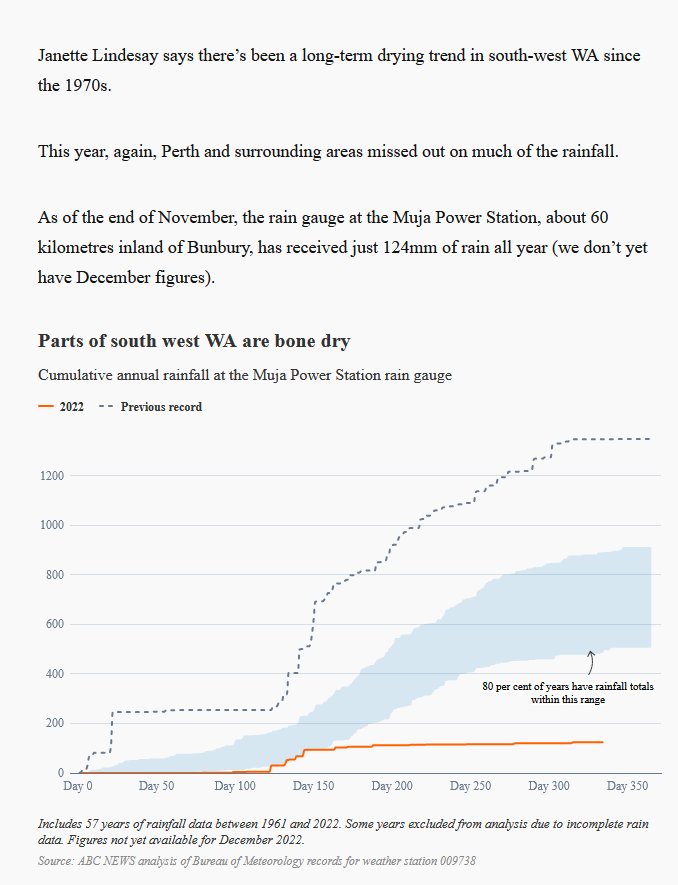
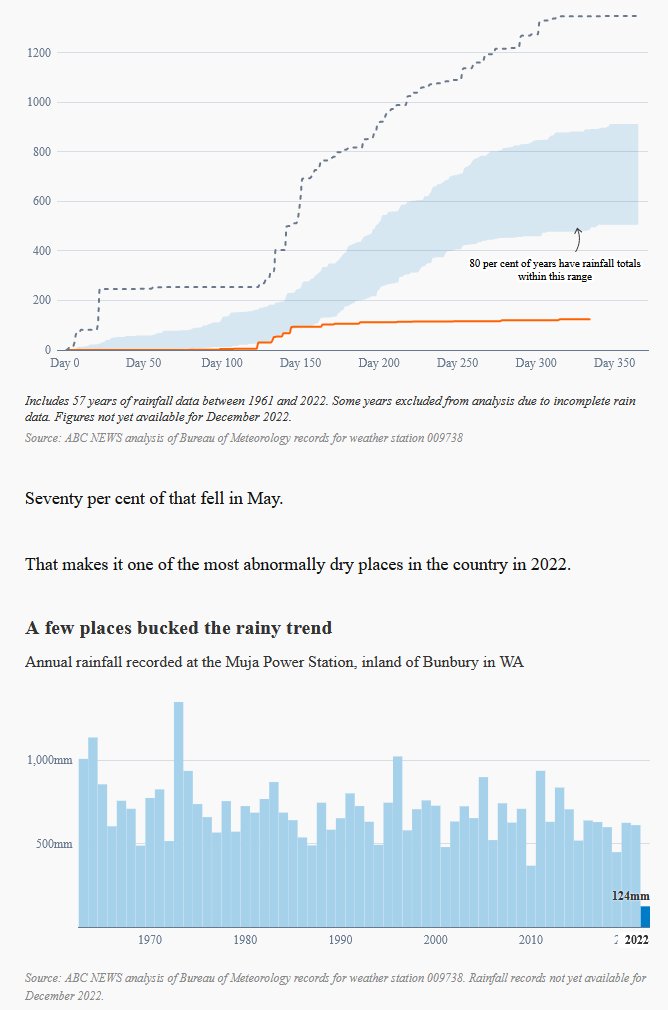
There are plenty of interesting graphics and photos to help us reprise 2022. Here and there through the article there are quotes from Professor Janette Lindesay, a climatologist at the Australian National University. About 2/3rds down their page we come to a map in shades of greens a greys preceded by text saying – “This map shows you how much wetter 2022 has been. We’ve taken data from nearly 1,000 weather stations, to map out how different this year’s rain is from the median of the past 30 years.” You see parts of SW WA are in a grey zone which means [10% dryer than …the median of the past 30 years”. Reading down under our grey and green map we see a quote by Professor Janette Lindesay “Janette Lindesay says there’s been a long-term drying trend in south-west WA since the 1970s.” Moving down the ABC says “This year, again, Perth and surrounding areas missed out on much of the rainfall.” Yet Perth Metro recorded 700.2mm in 2022 which is only 36.6mm under the annual mean. The ABC goes on “As of the end of November, the rain gauge at the Muja Power Station, about 60 kilometres inland of Bunbury, has received just 124mm of rain all year (we don’t yet have December figures).” Beneath that are two charts headed by “Parts of south west WA are bone dry – Cumulative annual rainfall at the Muja Power Station rain gauge” This graphic
www.warwickhughes.com/agri16/ABC-Muja-rain31Dec22.jpg
and the chart underneath shows how BoM rainfall data from Muja Power Station BoM #9738 has only recorded 124mm rain for 2022. www.warwickhughes.com/agri16/ABC-Muja-rainb31Dec22.jpg
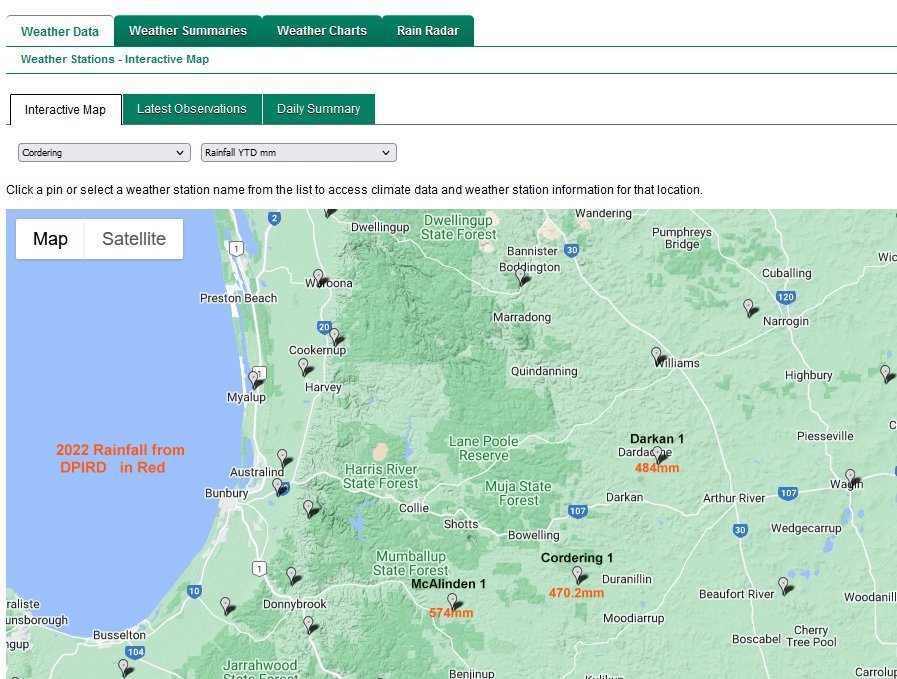
I have checked rainfall from surrounding BoM and WA DPIRD gauges and those data offer no support for the notion that Muja Power Station BoM #9738 can be relied upon. Here are links to two Collie/Muja district maps annotated with 2022 rainfall, one from BoM -https://www.warwickhughes.com/agri16/BoM-Muja-district-rain2022.jpg
and the other from WA DPIRD.- www.warwickhughes.com/agri16/DPIRD-map.jpg
Remember the WA DPIRD has a separate network of weather stations indie of BoM.
You can make various 2022 rain maps now at this BoM page –
www.bom.gov.au/climate/maps/rainfall/?variable=rainfall&map=totals&period=12month®ion=wa&year=2022&month=12&day=31
Below here hoping to show screen save of Muja Siteinfo pdf page 9 re rain gauge failing performance tests in 2011 – see comments below

So irrigation is only 1% of the Murray–Darling Basin!!!
The BoM has opened new www pages about the MDB and this “megafact” jumps out.
mdbwip.bom.gov.au/999/#4.6/-31.5/147
1,061,469 km2 total area of MDB.
11,000 km2 irrigated area (2019–20) – 1% of total area.
Our GreenLeft anti-dam brigade that now rules the wide brown land works hard to increase river water wasting to the sea.
I will add data putting MDB dams in true perspective.
Our GreenLeft ALPABC has just published this bad mouthing of Burrendong Dam.
From ‘moonscape’ to ‘oasis’, the pitfalls of controlling water in worsening climate extremes
www.abc.net.au/news/2022-12-20/how-to-manage-water-as-climate-extremes-deepen/101769978
Eugowra NSW flood history from the 1800’s out of old newspapers
This is a guest article by Lance Pidgeon who has put time into extracting old press reports from Trove the National Library of Australia pages of historic newspapers.
EUGOWRA. MOST CLUELESS FLOOD WARNING ON RECORD? by Lance Pidgeon. see links in first comment below
There is an image from trove missing at the start of Lance’s article –
By chance Our ABC compiled a photo essay “Wiped out and wanting answers – As the residents of Eugowra begin to rebuild their lives after a deadly flash flood saw them clambering onto rooftops, they are also searching for answers as to how the scale of the disaster caught them by surprise. By Xanthe Gregory and Jessica Clifford ABC Central West Updated 6 Dec 2022
MDB floods widespread but GreenLabor planning huge enviro flows
With floods progressing slowly downstream over such large areas of the Murray Darling Basin surely this is a time that all the various factions that over a decade ago GreenLabor wove into their MDB plan could let the current huge flows work naturally through the system which should result in a huge flushing of fresh water to the sea.
Our GreenLeft/ALPABC reports —
Water Minister Tanya Plibersek says Coalition dam money will go towards secret fund to buy water rights from irrigators 30Oct22
www.abc.net.au/news/2022-10-30/tanya-plibersek-dam-money-go-to-water-buyback-murray-darling/101591002
The Minister seems to be gloating about stopping Morrison Govt dam projects which were already stalled in antidam State bureaucracies and using the $Bns to buy water out of the MDB plan for future flushing downstream to the sea.
Making the MDB a smaller & less important future food-bowl and the wide brown land will be a weaker food producer.

2021 update 47 years Perth dams catchment May-Oct rain index
Overdue that I updated the chart for my Perth dams catchment May-Oct rain index
July 2021 was a big month for Perth dam catchments rain and I blogged –
Bickley in Perth Hills wettest year since 1996
NSW gets some rain and anti-damism cancels dams
Two ABC articles in the last few days tell the story. Remember in Mid October 2019 while a drought was on in NSW PM Morrison offered NSW, with ex Premier Berijiklian at his side, a $Billion Fed moolah for a new Dungowan Dam (Tamworth water supply) and enlarged Wyangla Dam. I have blogged twice on the issue that nothing was happening on these projects except paper pushing – ScoMo $Bill on NSW dams 27Sep2020 www.warwickhughes.com/blog/?p=6535 – and late last year – Anti-dam greens rule is total in NSW 4Nov2021 www.warwickhughes.com/blog/?p=6814 . Now OurABC reports $350 million Mole River Dam near Tenterfield scrapped amid doubt about NSW dam projects www.abc.net.au/news/2022-06-01/350-million-dollar-mole-river-dam-near-tenterfield-scrapped/101118102 and NSW dam managers face huge challenge to stop rivers flooding during near-record wet www.abc.net.au/news/2022-06-03/burrendong-dam-record-rainfall-managing-flooding-risk/101122316 – Sorry about lack of normal hyperlinks. I updated WP and now it has taken away the normal edit functions when writing a post.
ScoMo hapless in face of flood anger at Lismore
Nothing here goes close to meeting the pub test. No argument with the Feds disaster relief and National emergency declaration but people have to accept that they chose to live in one of the most flood prone areas in the wide brown land.
I note pollies(Littleproud was one) are throwing around “unprecedented” and caving to the GreenLeft by accepting that current floods are due to “climate change”.
I would not accept the “unprecedented” claim until we had a report by independent meteorologists & hydrologists assessing all rainfall and river data back 140 or more years.
[1] The report should contain maps and tables of rainfall stations for every decade so the increase in stations is obvious.
Station numbers would have increased in recent decades making it more likely to register high daily readings.
[2] The report should show by maps and analysis of historic landuse data the increase in areas cleared for agriculture over 140 years. Aerial photos mostly post WWII will allow more accurate assessment of land clearing in the last 70 years. Satellite imagery should assist in recent decades. It is well known that rainfall on forested land does not runoff as quickly as on cleared grassed farm land so flood peaks tend to be lower.
[3] The report should show by maps and analysis of historic urban data the increase in urban areas and population over a hundred years because rain on urban paved areas would runoff and contribute to flooding quicker than on farmed or bush areas.
[4] There should be a look-back analysis at post WWII State Govt and council planning changes relevant to building houses and shops/commercial buildings, in flood prone areas and an assessment of levees at Lismore.
The HISTORY OF LISMORE FLOOD EVENTS 1870-2017 is from Lismore City Council Large Chart

NSW North Coast rivers waste 12 Sydney Harbours to sea in a week
I just tallied the spreadsheet from NSW Water click on Daily River Reports on the left which brings up a spreadsheet in two sections. One with River Levels & Flows and a second with Dam Levels. I summed the flows for rivers between the Hunter and Tweed and it made 6 Million ML which is 6 Thousand GL or 12 Sydney Harbours. There is no discussion whatsoever about a dam or two in headwaters where water could be piped through to the western rivers. A sort of Mini version of Bradfield.
ABC jumps shark in Roper River fairystory
We are all used to the ABC beating up climate, environmental and indigenous issues. Here we have a resources company as the classic bad guys who are applying to use 3,300ML (3.3GL) of Roper River water per year to process heavy minerals. The ABC headline “Roper River will ‘disappear’, traditional owners say, as government considers massive water allocation” – academic experts are quoted. Words such as ‘disappear’ and ‘massive water allocation’ would have many ABC readers enraged that such perfidy and disregard for the environment indigenous people could happen. However a quick check of Wikipedia reveals the Roper mean annual outflow to be 5,000GL – so the mine wants 0.06%!!! The quota would be lost in the noise of the maths uncertainties. I am sure the Gov could devise a scheme for the miner to dam some water in the wet – would never be noticed – then provide export income, wages, royalties, taxes, fund universities, indigenous employment, improved outcomes all around.