Perth
and Catchments Rainfall History and Water Resources
|
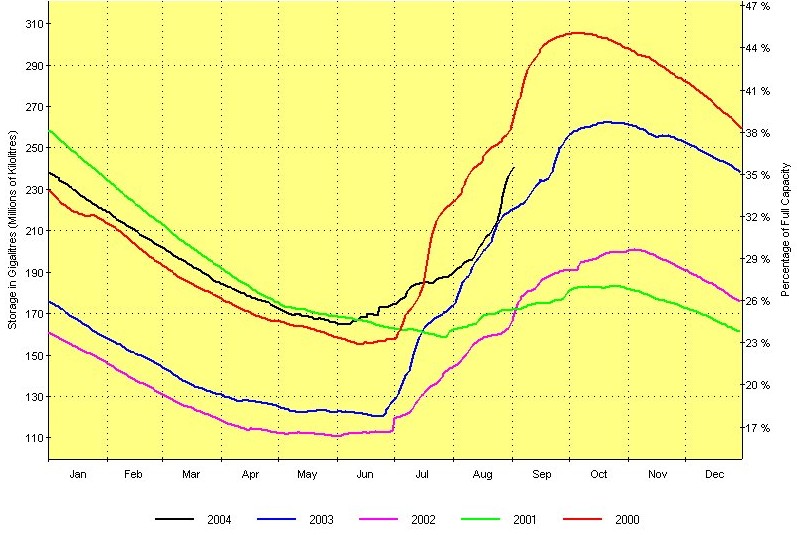
On 15 April The West Australian ran front page
headline, "Perth faces another dry winter disaster" Click for 1
September dam storage graphic from Water Corporation showing dams
starting to take inflow early this year and inflows increasing after a
wet August. Dams
 Tim Flannery statement The
West Australian 25
June that "...Perth will die..." gets me to start a press page.
Click on Dr. Tim. Tim Flannery statement The
West Australian 25
June that "...Perth will die..." gets me to start a press page.
Click on Dr. Tim.
I can cope with a politician, the WA Premier making para-normal
statements about water resources ("..we are in a 25 year drought...")
but for a scientist to swallow CSIRO climate modelling as though
it is written on tablets of stone, has me puzzled. Could it be
the Federal election due soon ? Could this talk scare a
few more waverers into voting Green ? Any comments welcome.
Up to date prediction for just
above average SW WA rainfall in May-June-July 2004 from modeling by Scripps Institution of Oceanography. Click to
see global prediction.These pages have been posted by Warwick Hughes a free lance
earth scientist who
thinks there is room for more scientifically based input
into the debate over the future of Perth's water supply. Comments
can be emailed to wazzau2002@yahoo.com.au
Updated April 2004 by Scripps Institution of Oceanography. Click to
see global prediction.These pages have been posted by Warwick Hughes a free lance
earth scientist who
thinks there is room for more scientifically based input
into the debate over the future of Perth's water supply. Comments
can be emailed to wazzau2002@yahoo.com.au
Updated April 2004
Drought in Australia web site
|
Main contents:
rainfall history
forecasting
rainfall
misleading
WaterCorp graphic
climate change
forest thinning
Harvey
water
Cloud seeding
Questions for
Water Corporation
Perth Waters Users Group
Including comments on Government 29 July go ahead for seawater
desalination plant
Feb 05 comments on WaterCorp press claims
re MANJIMUP
water supply issues
|
Read how CSIRO Chief made incorrect claims re
SW WA rainfall data on ABC TV 7.30 Report
Summary: The 2001-2003 water
shortage in Perth and low dam levels represents a challenge for
ratepayers and voters.
The Government line is that climate change is the
cause and expensive new desalination facilities are a part of the
solution.
The truth is that decades of forest regrowth and
a lack of catchment management due to prevailing Green dogmas has
suppressed streamflows
and made a significant contribution to the current situation
along with slightly lowered rainfall of the last 30
years. The process of catchment degradation is continuing,
wasting too much
of catchment rainfall.
2003 rainfall for Perth at 853 mm was above the
average (791) for the years since 1975 and figures for 2004 ; dam
levels have improved and there seems no rational reason to expect that
rainfall ahead will not oscillate around the 800 mm PA
level, as it has for 130 years that we know about. A more
balanced approach is required by the Government before Perth people are
saddled with the most expensive city water in Australia.
Unnecessary spending on a massive desalination plant to augment
the Perth water supply must affect other Government expenditure on
schools, hospitals etc, there is no bottomless pit of public money.
.
The above graphic demonstrates clearly that there has been no
decline in rainfall which would imperil supplies to the point where we
have to consider expensive desalination options. 2001 was only
the 15th dryest year since records began in 1876. What has happened to
cause our water shortage is that consumption is ever rising, catchments
are being steadily degraded by scrub regrowth impairing runoff and we
have been less than prudent over a decade or more in putting off
projects that could have brought on new supplies from dams.
 Rainfall near
the catchments is of course more relevant to dam storage than Perth
rain and this map by Martyn Keen, WA
Dept. of Agriculture shows how catchment rain is so much higher than
Perth.
Click on map for larger version. Click here
for full map and legend.
Rainfall near
the catchments is of course more relevant to dam storage than Perth
rain and this map by Martyn Keen, WA
Dept. of Agriculture shows how catchment rain is so much higher than
Perth.
Click on map for larger version. Click here
for full map and legend.
Click for Dwellingup rain
history and we see that 2001 was a dryer year relatively than in
Perth. How blessed we are to be averaging a metre of rain per
year so close to Perth. Government proponents of the "Perth
water crisis" including the CSIRO often say that since
the mid 1970's there has been a 20% reduction in
rainfall in SW WA including Perth. My figures for Dwellingup show
an
average of 1313.8 mm 1934-1974 then 1181.8 mm from 1975-2003, so there
has been 132 mm decrease since 1974 which to my way of thinking equates
to a 10.05% reduction.
In the case of Perth, there was an average 880.3 mm of rain per
year from 1876 to 1974 and 791.2 mm 1975 to 2003, a drop of 89.1 mm per
year which equates to a 10.12% reduction in
annual rainfall. I am still looking for the 20%.
What the Government should do in 2004/5.
- The Kwinana
desalination
plant project should be put on hold and only a
research role maintained.
- A program of catchments management and bush thinning must start
so runoff will improve.
- Replace planned production from desalination with projects from
The Water Corporations "pipeline" of engineering projects.
- A tiny proportion of the money to be wasted on the desalination
plant should be diverted to a cloud seeding
project this winter and spring, now.
- The cutting of the Gnangara pines
should be brought forward, on the basis that the groundwater they are
suppressing (valued at the production of Kwinana desal plant) means
they have no net present value. Govt. should heed UWA proposal to
convert Gnangara pines in a decade to a mix of new urban areas and
native vegetation, freeing up 130 GL per year of groundwater.
- The Agritech
proposal
to desalinate Wellington Dam wastewater looks too good not to
take
up.
- The Premier could then announce that the money saved could
contribute to schools, hospitals etc.
All too easy but Hey !!, would the Greens be happy ?
The composite graphic below sums up major trends relevant to the
debate on Perth water supplies, data (except BoM rain fall)
extracted from Water Corporation Annual Reports.
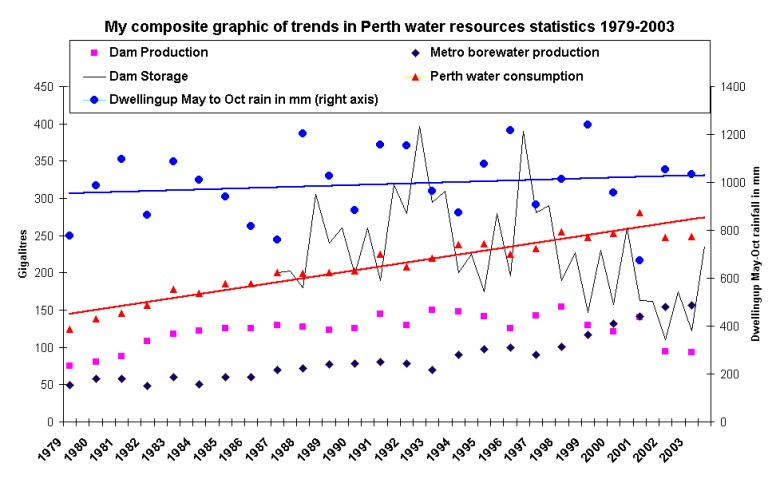
Salient points are;
- Consumption rising but trimmed by belated sprinkler restrictions
in 2002-3,
- dam production at early 1980's levels in 2002-3,
- ground water use drastically increased,
- no trend in rainfall from 1979-2003; will switch to a better
average for catchments when I have the data,
- storage starting to recover after being too low for six years and
rarely over 50% in last 15 years.
I am sure readers will correct me if I am wrong here but the contents
of this web page are based on the assumption that our society through
elected Governments plans for its future needs and welfare employing
experts such as engineers, scientists and economists who should have
due regard to
rational facts and the most accurate histories of natural data
possible. If this is not done we run the risk of basing
policy on belief, which puts us closer to Witch Doctor or
Cargo Cult societies.
The issues I am commenting on critically are mainly those that I can
see have been inadequately dealt with to date.
These are;
- historic rainfall
data,
- could more be done in forecasting
rainfall for next few years, see work by Dr. Warren B. White,
- the misleading
streamflow graphic produced by The Water Corporation to
be often used in their reports and now even more misleading
on the new ourwaterfuture web site,
- proposals to pipe a tiny fraction of Kimberley water
to Perth are always shot down on cost but we should be looking at this
water being piped south in the context of a "Nation Building"
project linked to new migration above the 26th parallel,
- unproductive bleating about "climate change"
- as if climate is ever not changing,
- the issue of selective
logging and bush management in catchments which could increase
stream flows to levels of some decades ago,
- there is much evidence that cloud seeding
has beneficially increased rainfall in many Australian locations
yet this is never considered in respect of the Perth water shortage.
- half of Perth's water supply comes from groundwater
Back to http://www.warwickhughes.com/

Links

Nothing below here.
 Tim Flannery statement The
West Australian 25
June that "...Perth will die..." gets me to start a press page.
Click on Dr. Tim.
Tim Flannery statement The
West Australian 25
June that "...Perth will die..." gets me to start a press page.
Click on Dr. Tim.