On an IPCC web site there are diagrams presented that illustrate the results of the CSIRO ( and other ) models in replicating rainfall month by month for Indian Ocean Islands, relevant to WA I would think. I have coloured the CSIRO effort.
In Water Corporation reports there are many hand wringing bleating references to "climate change" as though this somehow suspends rational planning processes. I see also in recent press reports the CSIRO climate folks getting into the act with their models.
Let's hope the whole debate does not get any further towards the para-normal.
To be fair, on the new Water Forum web site it is said;
"There are a number of factors being investigated
to explain the drop in rainfall. Although similar to changes
expected as a result of global warming, it
is more likely they are being caused by natural variation in climate. Other
factors, such as changed land use and local
air pollution, are unlikely to be major contributors, since rainfall
declines are being recorded just as strongly
at the Rottnest Island Lighthouse as they are in other parts of South
West WA."
Good that the concept of natural variation of climate still has its head above water.
The Water Forum web site correctly says that, "Other research is looking at links with El Niño, sea surface temperatures and pressures, southern ocean currents, and North West cloud bands.". Of course we expect that our Universities and public service science establishments are examining these ideas.
Is it coincidental that about 1976 there was a shift in global ocean currents linked to a sudden jump in global temperatures, just about the time Perth rainfall was declining and missing out on high rain years.
29 August. Comments & impressions from a morning at a Water Forum, wow you would think IPCC version of "climate change" was the dominant science governing water resources. It is quite ridiculous that a whole raft of contentious and irrelevant IPCC greenhouse "science" is being used to snow people about Perth water issues rather than simply letting water supply experts get on with their job.
But apparently that would offend the Greens.
A leading public servant scientist who surely knows better said words
to the effect that "....all our water planning was based on the high rainfall
years and now this climate change is forcing this reappraisal".
How an intelligent man could put across such a transparent distortion
is amazing. The shift in rainfall took place in the mid 1970's !!!
The high rain years in Perth were from 1915 to 1967, water supply planners
have had over 20 years to come to terms with increasing consumption
and the slightly lower less variable rain regime. Except for two brief periods
dams have been under 50% full for over a decade.
Another mantra is references to the "...long and sustained drought of the last 25 years..", also repeated by the Premier. I would like to hear from anyone who can justify statistically that this whole period has technically been a drought.
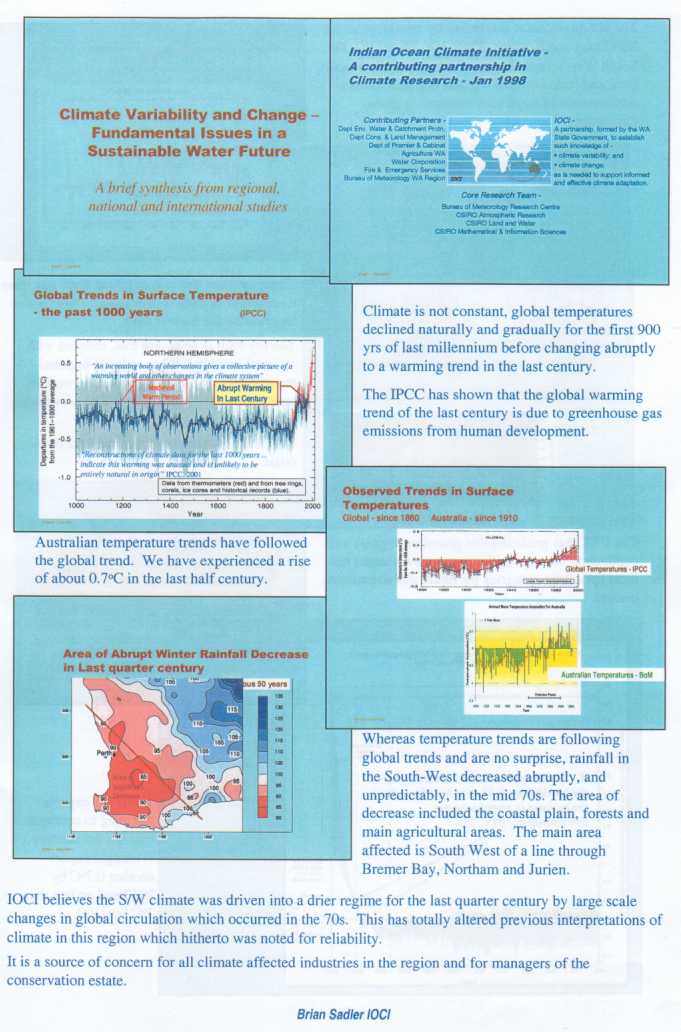
There was a coloured handout of various climate change propaganda which
is scanned below. Put out by the Indian Ocean Climate Initiative.
Seem to be recycling tired old climate model results from the CSIRO and casting
about for a seat at the Govt. funding table. Climate sceptics will
recognize the usual suspects, headed by the notorious Mann Hockey Stick graph.
What relevance the Mann Hockey Stick graph has to Perth water supply
I am a loss to understand.
Page 1 Note that the Medieval Warm
Period is highlighted, not a wise move considering farming conditions
in Greenland have certainly not returned to the halcyon days of Viking
times.
On the right the dear old Phil Jones graph compiled with data from every
urban heat island on the planet.
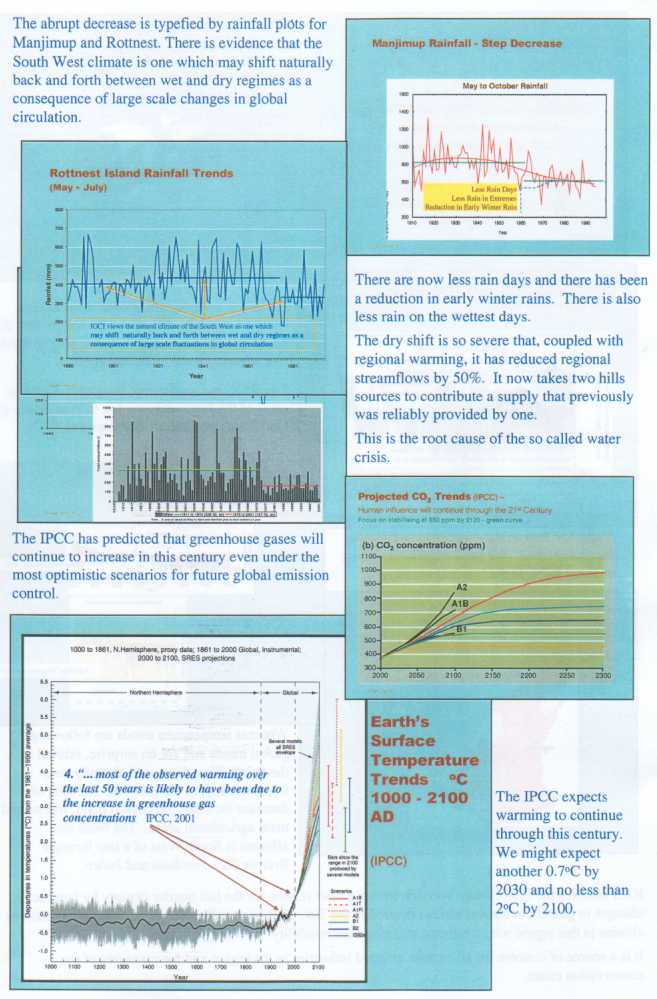
Page 2 Features the misleading WaterCorp graphic in black and even sillier IPCC model results.
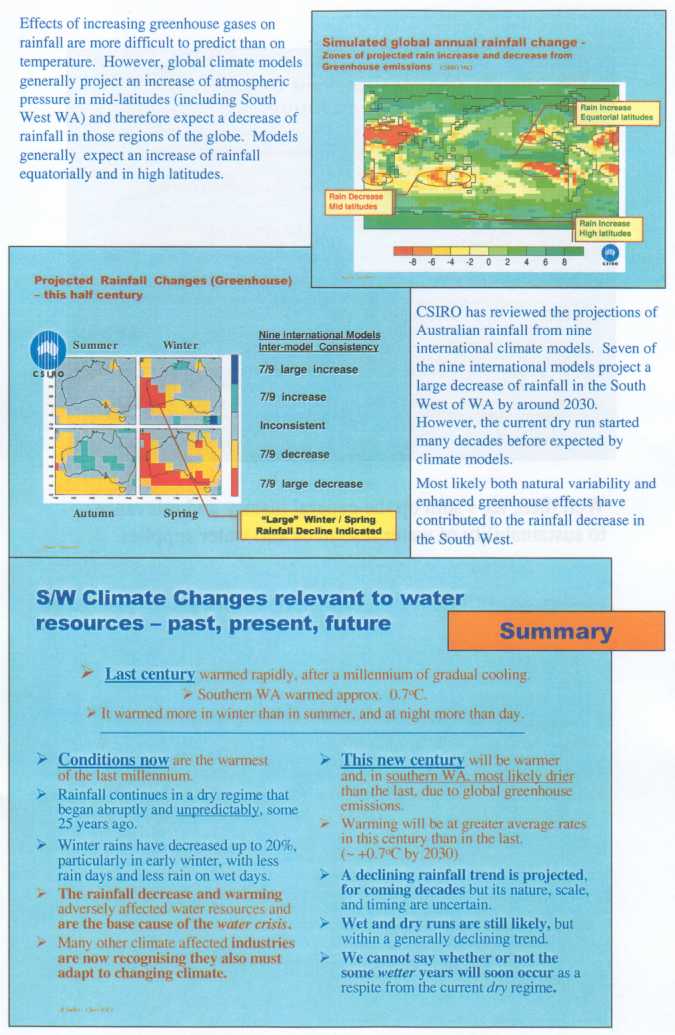
Page 3 CSIRO global rainfall modelling. Pity that they ignore the fact that rainfall Australia wide last century increased slightly. Point 2 in the Summary says "rainfall continues in a dry regime". I think any expert in global rainfall would not say we are in a dry regime. It would be just as logical to say we were in a wet regime from 1915 to 1967 and returned to normal rain patterns ~25 years ago.
Reliability of CSIRO climate models re future rainfall
First a comment by Dr James R Mahoney, Assistant Secretary of Commerce, for Oceans and Atmosphere before the Committee on Science, US House of Representatives, July 10, 2002.
Dr. Mahoney presents a review of research by the giant US climate group
NOAA (National Oceanic and Atmospheric Administration). Downloadable
pdf file available if you email me.
At the bottom of page 4 under a section headed Continued Scientific Enquiry
he lists 6 bullet points “…illustrative of the need for improved scientific
understanding.”
Point six says “The poor regional performance of general circulation models…” My bold added.
There it is, Dr. Mahoney is saying that climate models such as the CSIRO has used to generate future rainfall scenarios for Australia have a “…poor regional performance..”.
OK, lets not necessarily take Dr. Mahoney’s word for it.
On an IPCC web site there are diagrams presented that illustrate the results
of the CSIRO ( and other ) models in replicating rainfall month by month
for Indian Ocean Islands, relevant to WA I would think. I have coloured
the CSIRO effort.
We see the heavier plain line representing monthly mean observed rainfall
and we see that the CSIRO results fail to capture the major fact of high
January rainfall, getting the lowest of all model results in this regard.
Then the CSIRO get the most exaggerated result of all the models for
the vital months ( for Perth) of June July. Finally they utterly fail to
capture the salient fact that observed rain is pretty constant through June
to December. Finding instead a huge oscillation in winter / spring rainfall.
Altogether not a performance that would promote CSIRO expertise in
predicting future Perth region rainfall using their models.
As information comes to hand on these sorts of issues I will post them
here.
Back to PerthWater front
page