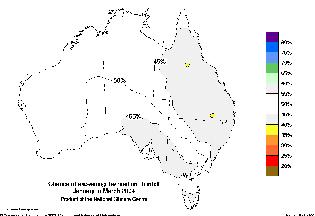
Series of BoM 3 monthly rainfall “Outlooks”
or predictions
|
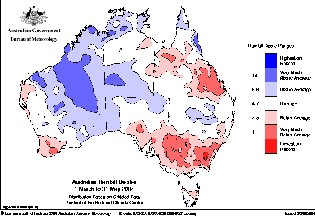
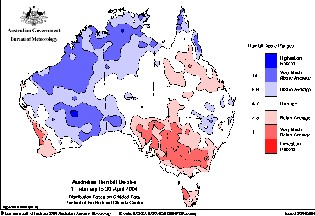
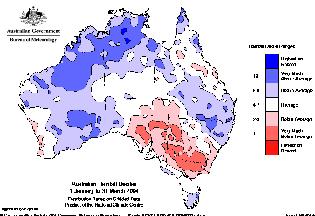
Rainfall anomalies published by the BoM for
same period as “Outlook” in left panel.
|
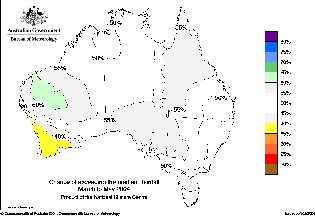
March 2006 prediction for
April
to June 06, "50:50 chances for above average June quarter rainfall",
love that 50:50 as the
BoM opts for a dryer southern SA and far W Vic but little
differentiation anywhere alse
|
Success for their small area of
predicted dry is offset by total failure in north as wet persists and
failure to predict intense dry areas in SW WA and eastern seaboard.
Small area of success for Pilbara predicted wet.
|
|
|
| February 2006 prediction for
March
to May 06, "50:50 chances for a wetter than average autumn", as
the BoM still goes for that dryer NE and this time a wetter
Pilbara. |
Huge failure in far north as dry
predict gets rained out. Large failure in NSW, S Qld and the
centre as rains fail where predictions were 50 50.
Intensity of SW WA dry not predicted but Pilbara OK.
|
|
|
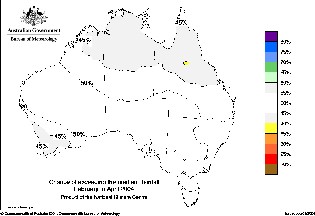
| January 2006 prediction for
February
to April 06, "Reduced seasonal falls in north Queensland", as the
BoM opts for a dry NE and wetter S and W. |
Dry predict for N Qld is total
failure. WA pretty good. Predicted wet in SA & Vic a 60% win. Dry
result from SE NSW through the centre is a failure as most of those
areas were predicted near 50%. Dry SE Qld is a partial win and the wet
far north was predicted to be dryer than the norm.
|
|
|
| December 2005 prediction for
January
to March 06, "Mixed rainfall outlook for early 2006", as the BoM
opts for three definite predictions. |
A minor win in the WA wheatbelt
but larger failure in the wet Pilbara - Gascoyne after predicted less
than 45%. Big failure in far N where predicted dry was swamped by
reality. Partial win for small pale blue area in NE NSW but
overshadowed by broader failure in surrounding dry areas. Tasmania
pretty much dead wrong again. Should have had some
predicted pale grey or yellow.
|
|
|
| November 2005 prediction for
December 05
to February 06, "50:50 chances for a wetter than average summer",
equivocates the BoM opting for a wet SE. |
HUGE area of WA wet was actually
predicted sl drier. SE wet predict turned out drier. Large Qld dry
area predicted sl wetter in the 50 to 55% zone. Just so WRONG,
everywhere.
|
|
|
October 2005 prediction for
November 05
to January 06, "Above average seasonal falls a 50:50 prospect", says
the BoM betting on a wet centre and dry east.
|
Wrong by most counts, the
dry E & SE predict turns out average or wet. The HUGE area of
WA wet was not predicted at all. SW Qld dry was not predicted.
Partial success with NT wet but offset by being wrong in the centre and
3 corners region. Tasmania, EXACTLY wrong again.
|
|
|
September 2005 prediction for
October
to December 05, "Mixed rainfall outlook for the December quarter", says
the BoM betting on a wet Pilbara - Gascoyne.
|
BoM have a win in NE Qld.
(Cheers) but it ends there. Big wet predict in west turns out
average. Major wet in NT, north WA crept up unseen.
Tasmania EXACTLY wrong again.
|
|
|
| August 2005 prediction for
September
to November 05, "Drier spring for parts of southern Australia",
specifies the BoM |
Southern Australia was much
wetter than the BoM model. Tasmania EXACTLY wrong again.Another
CLANGER as the BoM totally failed to see the major central to southern
wet coming.
|
|
|
| July 2005 prediction for August
to October 05, "Decreased seasonal falls more likely in northeastern
Australia", states the pessimsistic BoM |
Another complete failure for the
BoM as NE Australia turned out WETTER than average. The vast majority
of Australia turned out much WETTER than the BoM prediction.
Tasmania EXACTLY wrong again.
|
|
|
| June 2005 prediction for July to
September 05, "Neutral odds for exceeding average September quarter
rain", opines the pessimsistic BoM |
Some limited success in SW WA,
Pilbara, and SA-Vic border. The model completely misread the focus of
the standout dry anomaly in the East, which is located in the models
main plus 50% zone. Tasmania EXACTLY wrong again. Overall could not
score more than abourt 40%..
|
|
|
May 2005 prediction for June to
August 05, "Reduced winter rainfall more likely in parts of southern
Australia", sez the pessimsistic BoM about our main crop planting
season.
|
Another big failure for the BoM
prediction as vast areas of Australia incl Tasmania enjoyed average or
over average
rain. Their main little win in SW WA is lessened by the fact that
in the mid 1970's rain there declined about 10% and if the more
realistic average since
1975 was used, there would be much less red and more blue.
|
|
|
April 2005 predict for May to
July 05, "Wetter season favoured in SE Queensland and northern NSW"
repeats the BoM.
|
Good result for the SE Qld / N
NSW
predict. However west WA, southern Vic, Tasmania and Cape York, not so
good but
hey,
maybe a 55%.
|
|
|
March 2005 predict for April to
June 05, "Wetter season favoured in SE Queensland and northern NSW".
|
Maybe a 55% overall result.
Despite poor
results in SW WA, central WA and Cape York and much of
Vic.
|
|
|
Feb 2005 predict for March to
May 05, "Little signal in autumn rainfall odds" stumbles the BoM.
|
Plenty signal here. The
prediction is so wrong everywhere. SW WA
wet when predicted dry. Pilbara wet predict less than half correctNorth
NT dry marred by too much rain. Stand feature of the result was huge
dry anomaly from Snowy Mnts. to E Pilbara, not the slightest hint in
the pitiful Outlook.
|
|
|
| Jan 2005 predict for Feb to
April 05, "Drier season more likely in north Queensland" says the BoM. |
The peak dry event was in SW NT
& NW SA. The predicted peak wet area in Pilbara was in fact
dry. The actual wettest area in SW WA was prdicted
dry. The wet predict for southern SA and far west Vic was
in fact dry. They totally missed the great central band of rain
deficiencies. Overall, say 35% score.
|
|
|
Dec 2004 predict for Jan to March 2005,
“Neutral
odds for March quarter rainfall” says the BoM
|
The broad area of rain deficit sitting east-west
from coast to coast was not hinted at in the prediction, so by this
major criteria the prediction was a failure. However the 55% contour in
SA and Vic turned out a partial success. Some success can also be
claimed for the eastern seaboard 45% prediction. Tasmania EXACTLY wrong.
|
|
|
Nov 2004 predict for Dec 04 to Feb 2005.
“Generally neutral outlook for summer rainfall” opined the BoM.
|
Townsville hinterland dry prediction was 99%
dead wrong. Vast areas of the inland and west had a dry summer, not
hinted at in the BoM prediction. Victoria’s wet summer also not hinted
at in BoM predict.
|
|
|
Oct 2004 predict for Nov 04 to Jan 2005 “Below
average seasonal falls more likely in parts of eastern Australia"
according to the BoM
|
Dead wrong again, VAST areas of eastern
Australia enjoyed average or above average rain. The BoM dry
predict for SE Qld & NE NSW turns out EXACTLY WRONG.
Victorian wet not predicted. Major dry anomaly in centre and Great
Sandy Desert not hinted at.
|
|
|
Sep 2004 predict for Oct to Dec 2004, "Increased
risk of dry conditions in far southeastern Australia", said the
BoM.
|
Most of "..far southeastern Australia."
was average or wetter; NOT dryer. Partial success with Pilbara wet
predict. West Victorian coast v good but inland Victoria a
failure. North Qld dry predict another furphy. Vast areas
of dry anomalies in centre were predicted in 50 to 55% zone,
exactly wrong.
|
|
|
Aug 2004 predict for Sep to Nov 2004 "Dry
Spring more likely in parts of SA, Victoria and NSW", says the BoM
|
Although the main predict dry area in SA
coloured brown was actually sl wet or average, the predict for dry in S
SA and W Vic had partial success. The N Qld dry predict was quite good
but the SW Qld wet predict turned out average or dry. The main
dry anomaly in
the NT was predicted sl wet. Dry anomaly in SW and S of WA carried a
55% wet
predict. The NSW coastal wet anomalies are in a predicted sl dry
zone. Overall, broad failures outweigh the few wins. Tas OK
|
|
|
Jul 2004 predict for Aug to Oct 04 "Seasonal
rainfall odds close to 50:50", says the BoM. Taxpayers should be asking
what possible use are predictions like this so obviously lacking
any relationship to real world rain patterns.
|
NT prominent dry areas predicted sl wetter, WA
dry anomaly in zone predicted to be sl wetter. Broad sl damp predict
for east Aust coastal turns out mainly dryer or average except for NSW
coast strip. Area of sl dry predict centred on NE SA turned out on
balance
av or sl wet. So most major points of the Outlook turned out to
be
unreliable. Tas Vic OK.
|
|
|
Jun 2004 predict for July to Sep04
"Increased falls more likely in parts of Qld and WA for September
quarter", says the BoM
|
North Qld predicted wet EXACTLY
WRONG. SW corner WA predicted wet also EXACTLY WRONG.
Pilbara to SA actual wet predicted sl dry. Tasmania wrong again.
I am starting to puzzle that pure chance does not more often give
them a win, anywhere.
|
|
|
|
May 2004 predict for June to August 2004 "Winter
rainfall odds
mostly neutral", says the BoM
|
South Australian wet was actually predicted DRY,
how wrong can they be ? SE Queensland dry actually predicted sl
wet. (Sure, I know it rained there on 1st Sept). Tasmania exactly
wrong again. Even the little predicted dry spot in north WA,
exactly wrong and entire predicted dry belt between N WA through NT
extending to SA and Vic to Tas just so wrong, actually 90% wetter or
average.
|
|
|
April 2004 for May to July 2004 "Generally
neutral seasonal rainfall odds", says the BoM
|
North NSW SE Qld predicted wet exactly wrong.
Tas. wrong again. central Aust huge wet area not hinted at in
prediction.
|
|

|
Mar 2004 for Apr to Jun 2004 "Mixed June quarter
rainfall odds in the east and south"
|
Large central wet not predicted at all, east NSW
predicted wet exactly wrong. Se Qld dry not predicted. SA
and Vic predicted dry turned out much weaker. West WA
v poor contrary to predicted contours. Tasmania exactly wrong , again.
|
|
|
Feb 2004 for March to May 2004 "Mostly neutral
autumn rainfall odds, except in WA", says the BoM
|
Good result in WA but not covered in glory
elsewhere.
|
|
|
|
January 2004 for February to April 2004 "Neutral seasonal
rainfall odds", says the BoM.
|
What can I say. Model utterly failed to pick up
major rainfall patterns, poor old Tassie wrong again
|
|
|
|
December 2003 for January to March 2004 "Neutral odds for
March
quarter rainfall", says the BoM.
|
Model fails to predict vast areas of northern
and WA wet. The centre is best result. The broad areas of
SA, Vic, NSW and Qld turn out EXACTLY WRONG. For SA Vic the
predicted 55% chance of wetter conditions turns out to be mainly drier
except for a thin coastal strip. NSW divides into two zones
separated by a NW / SE line, the SW zone was modelled slightly wetter
yet turned out drier while the NE zone was modelled slightly drier but
turned out wetter. The broad band of better rainfall from New England
NW into Qld was actually modelled to be drier than av. The model
also fails to pick up the Cape York rainfall and only the two
small pink areas in north Qld could be claimed as success.
|
|
|