The 2002 drought in Australia,
growth of a myth
Update 22 Jan 2005: John McLean has drawn
our attention to the graphics and data on the BoM web page http://www.bom.gov.au/cgi-bin/silo/reg/cli_chg/timeseries.cgi
The BoM downloadable Australian annual rainfall data 1900-2004 shows clearly
that the 2002 drought was "..just another cyclic drought...", with 340.56
mm of rain falling on average Australia wide for 2002. This amount
is about equal to 1994 at 340.62 but it was even drier in 1961 at 336.33
mm and 1905 had only 320.35 mm. If you can use MS Excel, run
a 3 year smoothing on the data and you will see the 1980's was drier than
current times as were several periods from the 1960's going back. It
will be fascinating to see if the BoM ever talks about these data loud &
clear to lay all the lies about the 2002 drought firmly to rest.
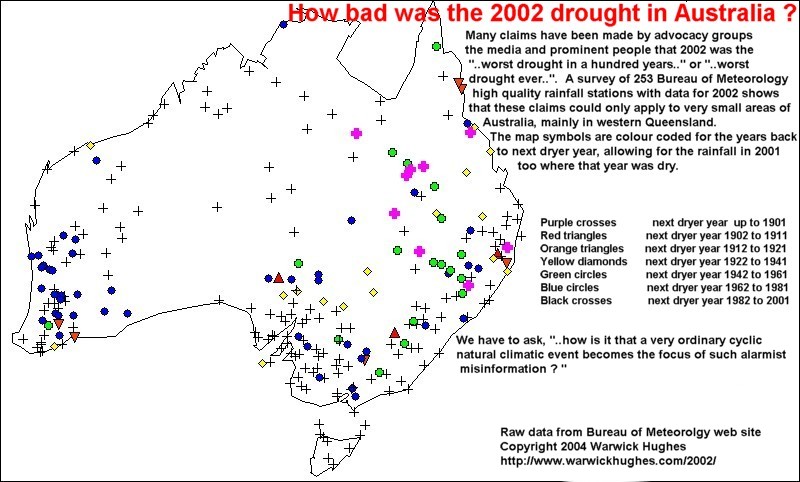
Original page posted 3 Oct 2004: Many claims have
been made by advocacy groups, the media and prominent people ( for
example the federal Treasurer and the Governor General ) that 2002 was the
"..worst drought in a hundred years.." or "..worst drought ever..".
In early 2003 we were very suspicious of these claims because most
rainfall histories we reviewed showed dryer episodes than 2002 at varying
time-spans back into the past but very rarely did we have to look back
100 years to find a dryer episode. At that time we did not have
an Australia-wide dataset but earlier in 2004 noticed the Bureau of Meteorology
(BoM) had posted on an ftp site a ~370 station "high quality rainfall dataset"
(HQRD) which we have reviewed.
What did we do ? We examined annual data for each station,
and after rejecting stations that either; had no data for 2002, or had too
many missing years or garbled data.
 We ended up with 253 stations with useful series of annual rainfall
totals, most of which extended back about a century, some about 120 years
and a few from more remote areas covered maybe half of the 20C.
We ended up with 253 stations with useful series of annual rainfall
totals, most of which extended back about a century, some about 120 years
and a few from more remote areas covered maybe half of the 20C.
We then manually checked the number series to pinpoint the most recent
dryer episode compared to 2002, taking into account 2001 if that was also
a dry year. The timespans back to the next worse drought episode
were rounded to the nearest decade and colour coded with a mapping program
used to portray the station localities.
Click on map for full screen version
Purple crosses next
dryer year prior to 1901
Red triangles next dryer
year 1902 to 1911
Orange triangles next dryer year 1912 to 1921
Yellow diamonds next dryer year 1922 to 1941
Green circles next
dryer year 1942 to 1961
Blue circles
next dryer year 1962 to 1981
Black crosses next dryer
year 1982 to 2001
It is obvious from the map that for vast areas of Australia the 2002
drought was simply a repetition of a similar but dryer event not too distant
in the past. Claims of "..worst drought in a hundred years.."
or "..worst drought ever.." can only be justified for a very small proportion
of the area of Australia, mainly in western Queensland. The name
"Great West Queensland Drought of 2002" is proposed.
How is it that the Myth of "Australia's worst drought" grew so
fast and these manifestly inaccurate claims get such wide currency ?
We have to realize that the media thrives on gloom and doom bad news
stories to sell papers and rate well on TV.
This will not change but we must be very sceptical of any claims made
on the media connected with the environment.
The media are natural allies of Green groups who have made an art form
of distorting the science of natural phenomena to generate
gloom and doom / sky falling in stories to convince us how terrible our
society is so we will vote for them or at least give them money.
In the case of drought there are also farming and rural groups suffering
financial uncertainty and it is unreasonable to expect an accurate view
of distant historical events from them.
Picture yourself running a farm in drought, a failing crop
staring you in the face, paying thousands to feed hungry stock, paying
to cart water, the TV crew arrives to get some pictures of dust and a sound
grab or two. Who could be objective enough to say, "..look
mate it was just as bad in 1994, or 1982.." or ".. Dad tells me that
in the '40's it went on year after year after year...". Very few
of us could be so objective with the TV presenter wanting a comment
relevant to right now.
Then of course there is an industry growing up around drought relief
and we can not expect them to be objective.
Politicians are happy to invoke an unprecedented higher force
outside our control to justify rural handouts while voters are unlikely
to feel any electoral loyalty to a member who argues that the drought is
just a normal cyclic hardship that must be planned for.
So we have a situation where a significant event in our natural,
economic and social history has been nationally reported and presented
in an exaggerated and distorted manner which clearly has induced
a false public opinion.
This can not be good for Australia and furthermore these distortions
will feed into public opinion on water resources, climate change, bushfire
issues etc.
Who can we expect to be objective ?
Clearly the public would expect the BoM to provide a bedrock
of objective statements on issues of rainfall, drought and climate.
Yet we find that when questionable claims are made eg. the WA Premier saying
"...we (Perth) are in a 25 year drought..." the BoM chooses to be silent.
The BoM with their computing power could use their own HQRD and
produce a similar or better map to mine above in minutes and could also
check the extent of multi-year dry periods say post 2000.
Readers have to understand that the media in general would not have a clue
about what questions to ask BoM people.
Readers have to know that rainfall data used to generate BoM drought
& rainfall maps (and guide BoM press releases) comes from many more
stations than in the HQRD and might include many stations with shorter
term data than the HQRD and also long term trends in the station data used
to generate maps might not necessarily agree with long term trends
in the HQRD.
We are looking for what the BoM has stated about the 2002 drought.
Notes on Data:
We have noticed that particularly in some Queensland coastal stations
there is evidence of a four year 2000 to 2003 low rainfall period which we
are continuing to investigate.
You read it first here.

Update 10 October 2004
The USA drought of 2002 also seems to have been the subject of media
hype. Researchers at Colorado State University have published;
Pielke, R. A., N. Doesken, O. Bliss, T. Green, C. Chaffin, J.D. Salas, C.
Woodhouse, J.l. Lukas, and K. Wolter, 2004: Drought 2002 in Colorado - an
unprecedented drought or a routine drought? Pure Appl. Geophys. accepted (available
from
http://blue.atmos.colostate.edu/publications/pdf/R-285.pdf
The lead author Prof. Roger A. Pielke Sn. says;
"We found that the consequences of the most recent drought
have been exceptional for some uses (e.g. suburban watering; wells, cattle
grazing), but the precipitation deficient for most areas in Colorado was
not exceptional (although quite dry). The reason for the heightened consequences
(and awareness in the media) is that there is more competition for the available
water, due to population growth.
This past summer, most of the short term consequences of the drought were
eliminated (despite poor snow in the mountains last year) for the urbanized
Front Range region of the Colorado Rockies due to a very cool and wet summer.
The long term consequences of the dry years, however, such as low storage
in Lake Powell and Lake Mead continue. This is a human caused shortage due
to the population requirements and competition with agricultural uses, not
an unprecedented precipitation shortage."
Information about Colorado State research is found;
http://blue.atmos.colostate.edu/
http://climate.atmos.colostate.edu/