Coolwire
Issue 9 July
2004
Greenhouse, global warming,
climate change, IPCC events, news, articles,
mostly from the Internet & email groups, much of which will
never find its way to mainstream media.
The idea is to post new material as soon as it comes to hand
and maybe close off issues each month.
Feedback and articles to climate@webace.com.au please.
I trust all the original authors
are acknowledged, I have tried to include url's to their sites
where available. Any green text is Coolwire comments |
Contents: latest on top
Who's who of atmospheric scientists
finds, No enhanmced greenhouse global warming trend in troposphere.
ABC TV 7.30 Report Claims June
July Sydney temperatures are so hot they are SCARY. Coolwire
finds many other Junes & July's had hotter days, so we say ill
informed journalists are SCARY.
Macquarie University study links rainfall
decline to land clearing in SW West Australia Coolwire thinks
their story implausible.
Hockey Stick Graph Finally
laid to rest by the efforts of two Canadian maths experts.
|
A landmark paper by a panel of international authors
surveying temperature trends in various layers of the global atmosphere and
which pulls together data from weather balloons and satellites has been reviewed
by Dr Vincent Gray
in his New Zealand Climate Truth No 53.
"Uncertainty in Signals of Large-Scale Climate Variations
in Radiosonde and Satellite Upper-Air Temperature Datasets",
Journal of Climate V 17,
D. J. SEIDEL,* J. K. ANGELL,* J. CHRISTY,1 M. FREE,* S. A. KLEIN, #
J. R. LANZANTE, # C. MEARS, @
D. PARKER, & M. SCHABEL, @ R. SPENCER,1 A. STERIN,** P. THORNE,
& AND F. WENTZ @
*NOAA/Air Resources Laboratory, Silver Spring, Maryland
1 University of Alabama in Huntsville, Huntsville, Alabama,
# NOAA/Geophysical Fluid Dynamics Laboratory, Princeton, New Jersey,
@ Remote Sensing Systems, Santa Rosa, California & Met Office,
Bracknell, Berkshire, United Kingdom
**All-Russian Research Institute of Hydrometeorological Information,
Obninsk, Kaluga Region, Russia
(Manuscript received 3 May 2003, in final form 30 September 2003)
ABSTRACT
There is no single reference dataset of long-term global upper-air
temperature observations, although several groups have developed datasets
from radiosonde and satellite observations for climate-monitoring purposes.
The existence of multiple data products allows for exploration of the
uncertainty in signals of climate variations and change. This paper examines
eight upper-air temperature datasets and quantifies the magnitude and uncertainty
of various climate signals, including stratospheric quasi-biennial oscillation
(QBO) and tropospheric ENSO signals, stratospheric warming following three
major volcanic eruptions, the abrupt tropospheric warming of 1976–77, and
multidecadal temperature trends. Uncertainty estimates are based both on
the spread of signal estimates from the different observational datasets
and on the inherent statistical uncertainties of the signal in any individual
dataset.
The large spread among trend estimates suggests that using multiple
datasets to characterize large-scale upper-air temperature trends gives
a more complete characterization of their uncertainty than reliance on a
single dataset. For other climate signals, there is value in using more than
one dataset, because signal strengths vary.
However, the purely statistical uncertainty of the signal in individual
datasets is large enough to effectively encompass the spread among datasets.
This result supports the notion of an 11th climate-monitoring principle,
augmenting the 10 principles that have now been generally accepted (although
not generally implemented) by the climate community. This 11th principle
calls for monitoring key climate variables with multiple, independent observing
systems for measuring the variable, and multiple, independent groups analyzing
the data.
ABC TV 7.30 Report
on 5 July 2004 carried a segment by Tracy Bowden lauding a WWF report entitled
"Climate Change - Solutions for Australia", attempting to beat up some
connection between dry conditions and Global Warming. The show started
with a young beach going couple enjoying the sand at Bondi and Coolwire
will just let the transcript from the ABC web site speak for itself.
TRACY BOWDEN: At Sydney's Bondi beach it is hard to believe it's
the dead of winter not an overcoat or woolly jumper in sight.
KATHERINE VAN EUERT, STUDENT: It's amazing. It is phenomenal.
GIDEON SILVERMAN: It is crazy to come down to the beach like this
in the middle of July.
Gideon and Catherine are making the most of their mid-year university
break but not without concern.
KATHERINE VAN EUERT: It's lovely to be able to look at this blew sky
for a few days but when it starts getting every day repetitively for the
last few weeks it is scary.
GIDEON SILVERMAN: It is beautiful but quite alarming at the same time.
TRACY BOWDEN: We should be alarmed according to the latest contribution
in the hotly-debated arena of climate change we're already in the midst
of it.
Coolwire's point is a very simple one and Tracy Bowden could have stopped
the 7.30 Report from using this shonky device to get attention had she
just called the local BoM office and asked how these warm days fitted with
Sydney's climate history. The 4th of July at 24C was of course a warm day
but according to Sydney Observatory Hill data there have been a dozen or
so warmer July days in the record. As for June, recalling
"KATHERINE VAN EUERT: It's lovely to be able to look at this blew sky for
a few days but when it starts getting every day repetitively for the last
few weeks it is scary", .the facts are there were fifteen
days above 20C scattered through June and 20C has been equaled or exceeded
382 times in June since records began in 1859.
So much for AMAZING.
So much for PHENOMENAL.
So much for CRAZY.
So much for SCARY.
So much for ALARMING.
Katherine and Gideon should enjoy the beach while they can and not stress
themselves out being alarmed, scared, whatever.
They were simply suckered to help sell a pack of wild and ill informed
WWF / ABC exaggerations.
What is ALARMING is the half a $Billion per year taxpayer funded broadcaster
putting out such silly garbage, repetitively brainwashing the viewers with
their Green mantras, presumambly imgaining in some juvenile way they are
helping save the planet.
The Sydney Morning Herald, June 29, 2004
reported in an article by Richard Macey "Climate change link to clearing",
that Macquarie University scientists believe they have found strong
evidence that land clearing can trigger devastating climatic changes and
that the climate can respond suddenly and dramatically, almost without
warning, to centuries of environmental abuse. The researchers used one of
Australia's most powerful supercomputers to model changing rainfall patterns
since the mid-1970s in the south-western corner of Western Australia where
some parts of the region have suffered declines of up to 15 and 20 per
cent in winter rain, threatening Perth's water supply. Previously
the CSIRO and the Bureau of Meteorology had blamed global warming and changes
to atmospheric and ocean circulation patterns for this SW WA rainfall decline.
|
|
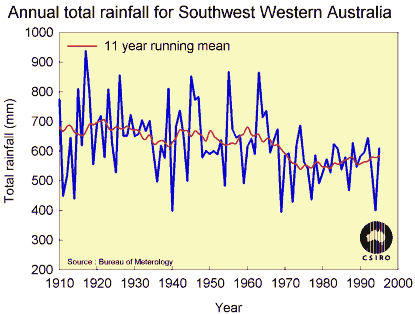
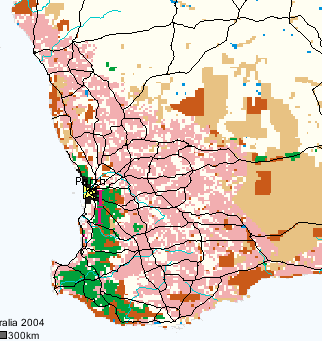
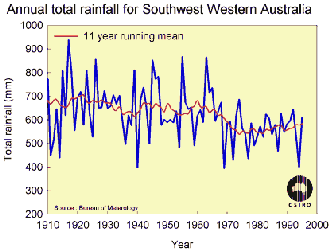
This graphic of SW Western Australian rainfall
history is generated at the CSIRO website http://www.dar.csiro.au/publications/Hennessy_2000b.htm
The lower level of rainfall from the mid-1970's is shown clearly
and if readers experiment making graphics for the various states on the
above CSIRO website they will notice that wetter or dryer periods happen
from time to time.
Coolwire has marked Perth Water supply
catchments approximate location on the land use map above right with two
vertical red bars and we note they are very close to the sea, whence cometh
the rain bearing cloud bands.
|
|
Coolwire has problems envisaging the mechanism
by which rain cloud bearing bands moving easterly from the Indian Ocean
can run into the uncleared and well forested Perth dam catchments and
immediately "be influenced" not to rain as much as they "might have in
previous more sylvan times" because the WA wheatbelt is cleared starting
several 10's of kms and some hours away to the east. This sounds like magic
to Coolwire.
 For the moment though we will abandon our scepticism and go with
the notion that if land clearing in SW WA can have this drastic
and sudden influence on rainfall there, then scientific principles
tell us that surely land clearing can have a similar effect elsewhere.
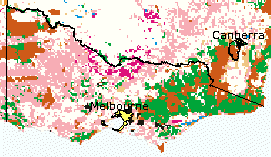
So we look for a suitable area in Australia with contrasting rates of clearing
for an experiment; now Victoria is mainly cleared in the west and uncleared
in the east, see land use map.
For the moment though we will abandon our scepticism and go with
the notion that if land clearing in SW WA can have this drastic
and sudden influence on rainfall there, then scientific principles
tell us that surely land clearing can have a similar effect elsewhere.
So we look for a suitable area in Australia with contrasting rates of clearing
for an experiment; now Victoria is mainly cleared in the west and uncleared
in the east, see land use map.
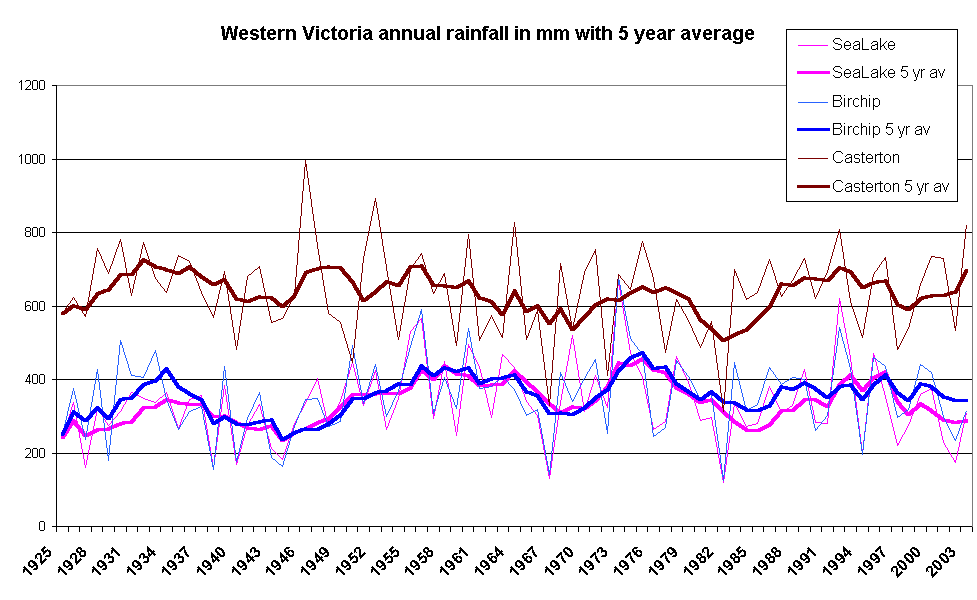
Looking at rainfall trends for western Victoria compared to eastern
Victoria we find that as usual in Australia rainfall goes through cyclic
periods of being a bit more wet or a bit more dry, seldom enough to please
everybody but with no sign that rainfall has declined "... suddenly and dramatically, almost without
warning, to centuries of environmental abuse."

|
This graph of three rainfall station trends from extensively cleared
Western Victoria using BoM high quality data shows no signe of a decline
as is seen in SW WA data. Trends are so simialr to the uncleared
Eastern Victoria that Coolwire has to conclude that the Macquarie University
study has wrongly attributed land clearing as the cause of the SW Western
Australia rainfall decline
|

|
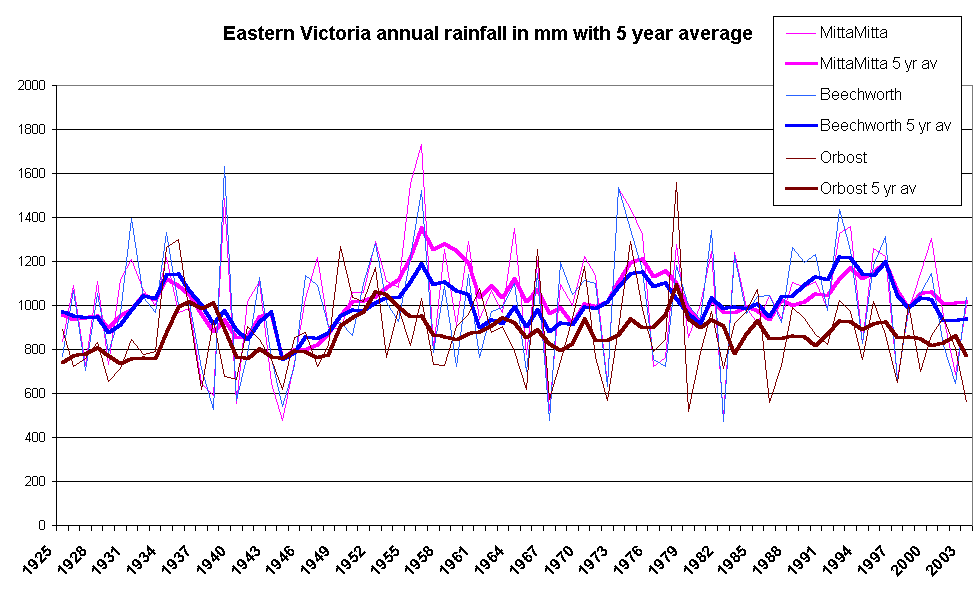
This graph of three rainfall station trends from relatively uncleared
Eastern Victoria using BoM high quality data shows broadly similar
cyclic variations as in Western Victoria, also suggesting that factors
influencing long term rainfall trends are to be found in broader scale atmospheric
and oceanic influences outside Australia.
|
 We are all familiar with the "Hockey Stick" graph portraying a
millenia of global temperatures which indicates that the 20th Century
was the warmest in all that time and that the Medaeival Warm Period (MWP)
and Little Ice Age (LIA) were very minor events with signals so low as to
barely be discernible on a global scale. The IPCC siezed on this work
by Mann, Bradley and Hughes in 1998 (see ref 1 below) (MBH98),
which relied heavily on tree ring analyses to construct a temperature series
back 600 years and despite adverse comments by many climate scientists sceptical
of such a radical revision of the Earths history, the MBH98 "Hockey Stick"
has been a key component of the IPCC "high ground" (see 2 below)
until 2003. Sometimes the "Hockey Stick" is portrayed with error bars.
In 1999 MBH extended their proxy temperature time series to 1000 AD
see ref 2 below.
We are all familiar with the "Hockey Stick" graph portraying a
millenia of global temperatures which indicates that the 20th Century
was the warmest in all that time and that the Medaeival Warm Period (MWP)
and Little Ice Age (LIA) were very minor events with signals so low as to
barely be discernible on a global scale. The IPCC siezed on this work
by Mann, Bradley and Hughes in 1998 (see ref 1 below) (MBH98),
which relied heavily on tree ring analyses to construct a temperature series
back 600 years and despite adverse comments by many climate scientists sceptical
of such a radical revision of the Earths history, the MBH98 "Hockey Stick"
has been a key component of the IPCC "high ground" (see 2 below)
until 2003. Sometimes the "Hockey Stick" is portrayed with error bars.
In 1999 MBH extended their proxy temperature time series to 1000 AD
see ref 2 below.
An example of early criticism of MBH98 which fingered key weaknesses is
the late John
Daly's internet paper "Broken Hockey Stick".
In May 2003 the Willie Soon; Sallie Baliunas; Craig Idso; Sherwood
Idso; David R. Legates paper "Reconstructing Climatic and Environmental
Changes of the Past 1000 Years: A Reappraisal", which was critical of
MBH98 was published in Energy
& Environment V14 2/3.
 In 2003 two mathematically inclined Canadian scholars,
a geologist Stephen McIntyre and an economist Ross McKitrick (M&M03)
joined to publish a detailed critical analysis of MBH98 in Energy &
Environment (see 5 below) after exhaustive retesting of the original MBH98
data.
In 2003 two mathematically inclined Canadian scholars,
a geologist Stephen McIntyre and an economist Ross McKitrick (M&M03)
joined to publish a detailed critical analysis of MBH98 in Energy &
Environment (see 5 below) after exhaustive retesting of the original MBH98
data.
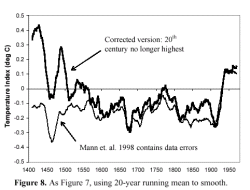
In a nutshell, M&M03 demonstrated the MBH98 tree ring analyses were
flawed and that early in the last millenium was warmer than the Hockey Stick
showed, see graphic on right. In June 2004 the original MBH98 authors have
had to publish a "corrigendum" in Nature (MBH04) (see 6 below) explaining
errors in MBH98, which of course they contrive to claim, do not affect
their conclusions. There is Supplementary Information (SI) or data sources
for MBH04
here.
M&M have an internet
response to the MBH04 paper plus a diary of their investigations.
There will be more published in this saga of the stunning demolition
by M&M03 of this now shabby IPCC icon.
This sorry and belated saga is the inevitable product of the flood of
dedicated Greenhouse funding that pours in to institutions producing
IPCC friendly research, where the road to publishing is eased by pliant editors,
where IPCC cosy researchers are able to trumpet new findings in the media
long before papers are published, where any sceptical scientist wanting to
look at data behind IPCC friendly claims has to wait months for a paper to
come out, then if data is available the debate is off on a new tack,
where the science Academies have abdicated responsibility and their position
largely taken over by the Stalinist IPCC. This has been going on for a decade
and a half now and the staggering M&M success may be but a brilliant
skirmish in the campaign against IPCC Klimatmeisters domination of atmospheric
sciences. We are yet to see what the IPCC will do with the Hockey Stick
but it is certain the Crays will be humming and the dollars flowing.
Key hard copy References:
1. Mann, M.E., Bradley, R.S. & Hughes, M.K. Global-scale temperature
patterns and climate forcing over the past six centuries. Nature 392, 779-787
(1998).
2. Mann, M.E., Bradley, R.S. and Hughes, M.K., (1999). Northern Hemisphere
Temperatures During the Past Millennium: Inferences, Uncertainties, and Limitations,
Geophysical Research Letters, No. 26, pp. 759-762. See also press release
at
http://www.umass.edu/newsoffice/archive/1999/030399warming.html.
3. Intergovernmental Panel on Climate Change (IPCC) Climate Change 2001,
Third Assessment Report (Houghton, J.T. et al., eds.), Cambridge University
Press, 881 pp. (2001).
5. McIntyre, S. & McKitrick, R. Corrections to the Mann et al. (1998)
proxy data base and northern hemispheric average temperature series. Energy
& Environment 14, 751-771 (2003).
6. Mann, M.E., Bradley, R.S. & Hughes, M.K. Corrigendum. Global-scale
temperature patterns and climate forcing over the past six centuries. Nature
430, 105 (2004).

You read it first here.
Return to Coolwire index
Return to Global Warming front page
Return to http://www.warwickhughes.com/