Central England Battle of
the Heat Islands
People have asked me about urbanization influences in the CRU
/ Jones temperature trends for the United Kingdom.
It has been suggested that these temperature records would be so
well known to CRU and The Met Office that the CRU / Jones
UK suite would be clean of influences from Urban Heat
Islands (UHI).
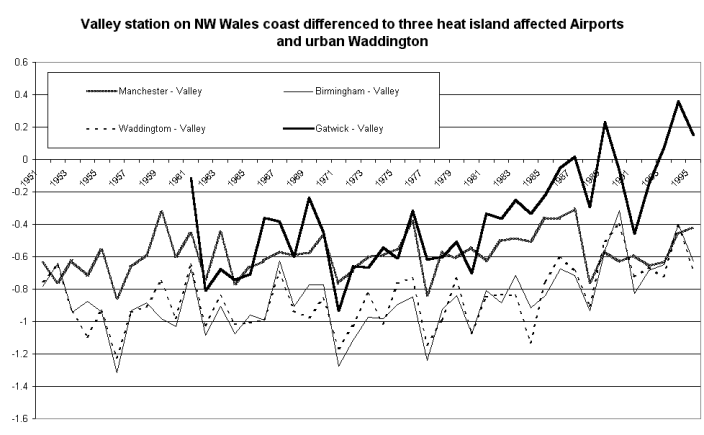
A quick look at Manchester, Birmingham and Gatwick airports and
the small city of Waddington, for the period 1951 to 1995
shows no lack of artificial warming. Stations referred to
are shown on map from MS Encarta 2000.
Differencing all four urban stations with the rural site
"Valley" on the NW tip of Wales, it can be seen that
Gatwick Airport has the most severe UHI
contamination. Manchester might have a cooling step at
1988, while both Birmingham / Elmdon Airport and Waddington
have closely comparable trends. If there was a rural
station in the Jones 1994 data closer to the group of urban
stations for the 1951-1995 period, then it would have been
used instead of the coastal Valley, which is not perfect.
Note the several simultaneous steps in the difference
trends near 1962, 1971, 1977, & 1988, which
suggest a series of warming steps in Valley.
When the warming trend of about 0.3 degrees over the 45 years
in Valley is taken into account, Manchester AP warms at 0.4
degrees in 45 years, Birmingham AP warms at 0.7 degrees in
45 years, Gatwick warms 0.9 degrees in 35 years and Waddington,
0.7 degrees in 45 years.

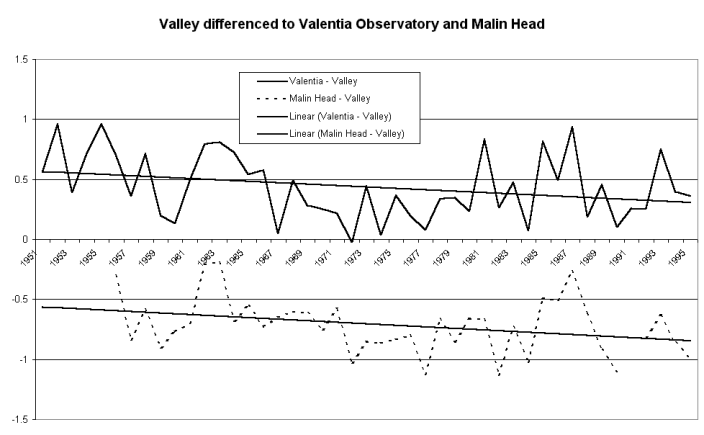
The case for the series of warming steps in Valley is supported
by the differences between the Irish stations Valencia
Observatory and Malin Head and Valley, see map above.
The graph below shows that both these difference trends indicate
non-climatic warming in Valley of about 0.3 degrees over the 45
years.

None of the stations reviewed above were subjected to any
corrections by CRU / Jones 1994.
The data used is all from Jones 1994.
This review is another nail in the coffin of this ridiculous
notion that moving a temperature recording site to an airport
somehow eliminates UHI influence. (see my page on Sydney).
Just another numbing example of the gross underestimation of
the extent of UHI contamination by this research group.
In this case of course there is The Met Office, arguably the
premier weather / climate group in the world, with many
more data
available than CRU / Jones have used.
I am not aware of any comments by Met Office people to the
Journals pointing out for example the UHI at Gatwick and the
other stations mentioned above. It would
be interesting to know what increase there has been in Met Office
research funding over the last 15 years due to the IPCC inspired
greenhouse / global warming issue.
Addition 24, August, 2000
Since posting this page on the 21st I have downloaded the
Central England Temperature (CET) Series 1659 to 1999,
(Parker et al 1992), from the Met Office web site, thank you all
very much.
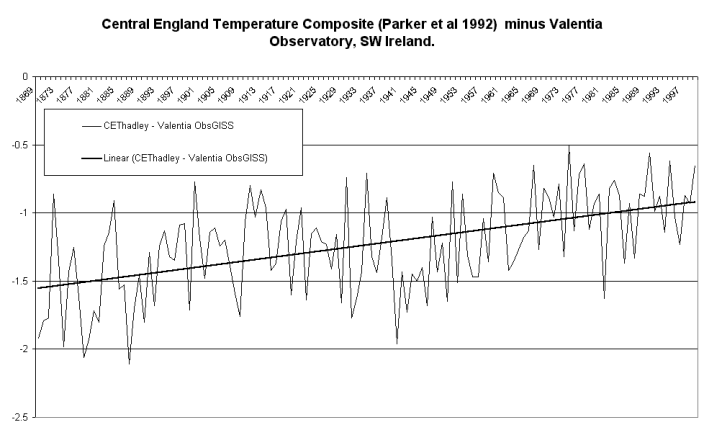
The only long term non urban station I can see to compare CET
with is Valentia Observatory on the SW tip of Ireland, see map
above. Valentia runs from 1869 and I used the GISS
version because they have data into 2000.
The graph below of CET minus Valentia indicates
that CET is warming at about the rate of global warming
compared to Valentia Observatory.
This suggests that despite all the care taken with the
CET construction by various authors, the raw data avalable must
have been too pervasively contaminated by urban warming to
adequately correct.

To see the 1869-1999 trends for these two stations clik here.
Clearly there is not much "global warming" happening
in this region going by Valentia Observatory.
You read it first here
Updated 21, August, 2000
© 2000 Warwick Hughes,
globalwarming-news.com
Back to National Met. Institutes Page
Back to Front Page


