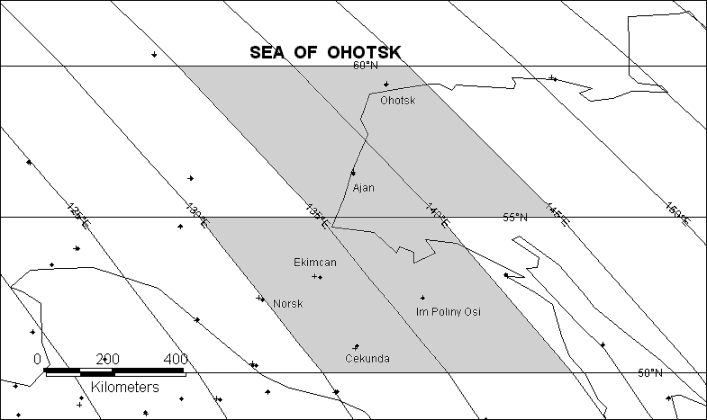
Four 5 degree grid boxes are located in the the region adjoining the Sea of Ohotsk
Figure 5
Ohotsk Grid Point 57.5 N-142.5 E
Ohotsk is the only station and there is data from Jones 1994, GHCN and GISS. Figure 6 shows all three records
Figure 6
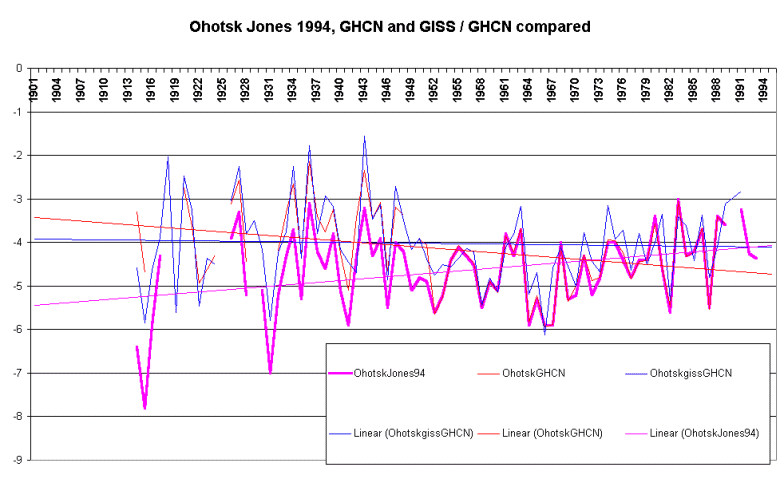
Salient points are:
* The Jones 1994 data has a warming trend of ~1.3 degrees over the 82 years. But the cool outlier around 1914 looks incorrect and is inserting a warming bias.
* The GHCN data has a slight cooling trend but could be affected by two missing years around 1931 which would otherwise have reduced the cooling.
* The GISS/GHCN record has had data gaps filled and has no trend.
* There is an early outlier of data 1891 to 1895 for Jones 1994 but this is before the time frame of the Karl 1998 map and does look anomalously cool, which could be enhancing the Jones 1994 warming trend.
Given the broad agreement between GHCN and GISS, it is hard to have any confidence in the strong warming trend from Jones 1994.
Ajan, Grid Point 57.5 N-137.5 E
In this grid box, there is again only one station, Ajan, in all three sources. Figure 7 shows all have data from 1932-33 and there is very little difference in trend. Jones 1994 warms a little more because of a few extra post-1989 data points not yet included in the other datsets.
Figure 7
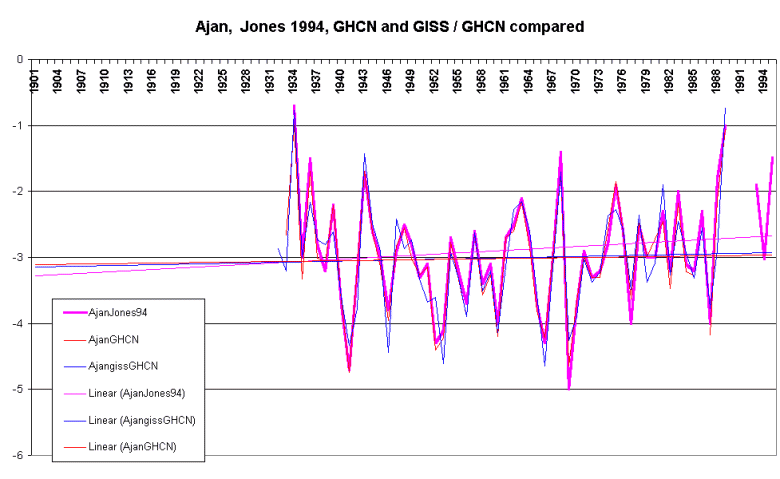
The warming trend over the 63 years in the Jones 1994 data is about
0.35 degrees. The writer is mystified as to how this grid box can
be rated as having warmed 2 degrees over 95 years.
Im Poliny Osi Grid Point 52.5 N-137.5 E
As in the first two grid boxes, Im Poliny Osi is the only station in this box and there are data from all three of our sources. Once again the trend warming in the Jones 1994 outstrips that in GHCN and GISS, this time at about 1 degree from 1936 to 1993. Once again, the reason is missing data in Jones: both GISS and GHCN found earlier data (starting in 1911 and 1914 respectively) resulting in practically flat overall trends.
Figure 8
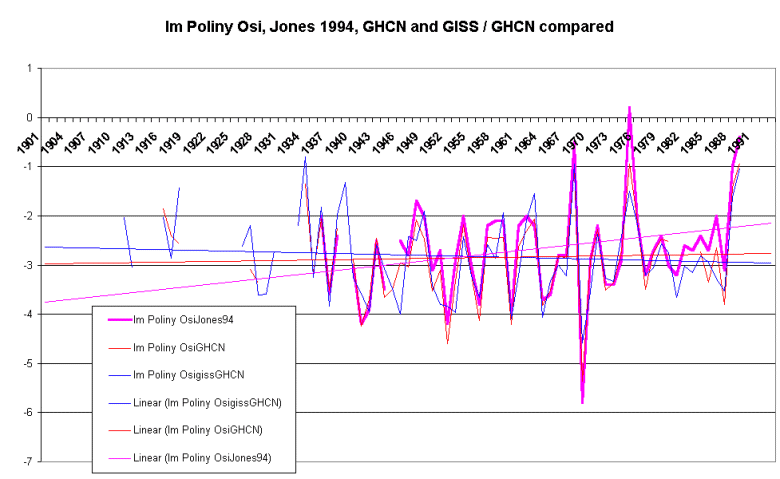
Again there seems to be no obvious justification for the sizeable warming in Jones, which was carried over into the Karl 1998 warming map.
Ekimcan Grid Point 52.5 N-132.5 E
For this final grid box all the sources have data from two stations: Ekimcan, with data from 1914/16 to 1989 and Cekunda with data 1936-1989. Figure 9 shows the data from the three sources and once again Jones 1994 shows most warming: about 1.9 degrees over the 1914-1989 span, consistent with the 2 degree warming dot on the Karl 1998 map. GISS has about 0.65 degrees warming and GHCN near 0.9 degree over the same timespan.
Cekunda has similar warming to Ekimcan but over a shorter timespan.
To save space, it is not shown, but it does not look homogenous with Ekimcan
in earlier years.
Figure 9
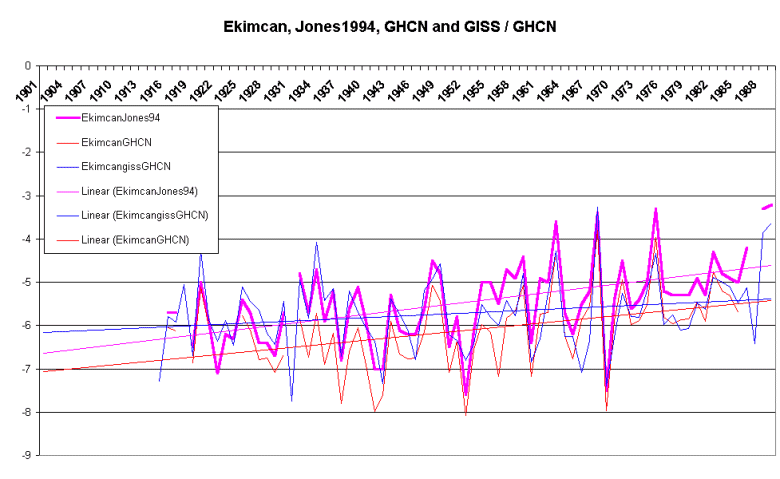
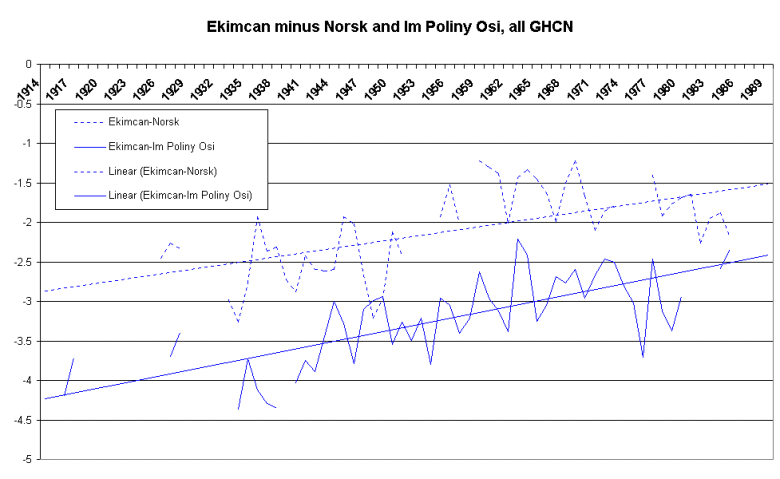
Figure 10 shows a difference graph: Ekimcan minus its neighbours Norsk
and Im Poliny Osi, using GHCN data. All of these stations
and Im Poliny Osi are classed as rural in GHCN, i.e. population is under
9,000. Figure 10 demonstrates that the Ekimcan warming must be treated
with suspicion because the station warms ~1.5 degrees 1914-89 relative
to Norsk and Im Poliny Osi, neighbours to the west and east, see Figure
5.
Figure 10
So, in this grid point, warming close to the Karl 1998 magnitude is found in the Jones 1994 record, but the source -- Ekimcan -- is suspect as shown in Fig 10.
Summary for Sea of Ohotsk Grid Boxes
We have reviewed all the stations in the four grid boxes near the Sea of Okhotsk that the Karl 1998 map in Figure 1 shows as warming at 2 degrees over 1901-1996. The claimed warming in all four boxes was found to be doubtful. If examination is limited to homogenous data from rural stations, no warming trend of anywhere near 2 degrees is apparent.
The Jones 1994 data on which the Karl 1998 map is based consistently
warms more than GHCN and GISS. This should be a danger signal to
those who assume that the broad agreement of various temperature aggregates
at the global level means that all are based on similar results at the
regional level.
You read it first here
© Warwick Hughes, 2000 - 2001
globalwarming-news.com
Warwick S. Hughes, 22, July, 2000. Re-written 24, June, 2001