| Greenhouse, global warming, climate change,
IPCC events, news, articles, mostly from the Internet & email
groups, much of which will never find its way to mainstream media.
The idea is to post new material as soon as it comes to hand and maybe close
off issues each month. Feedback and articles
to climate@webace.com.au please. I trust all the original authors are acknowledged, I have tried to include url's to their sites where available. |
Contents in order: Paper critiqueing IPCC Myths and Fallacies; Iceberg pens in Penguins, Summer Skiing in NZ, Bob Fosters latest criticism of CSIRO complete with Figures, |
Concise and comprehensive paper by Dr Chris de Freitas
pointing out myths and fallacies in the entire IPCC position. Dowloadable
pdf file just over 1 Mb.
It will be a white Christmas at Mt Rupaehu this year as Ruapehu Alpine Lifts (RAL) announces the special re-opening of Whakapapa Ski Area for summer skiing and boarding from December 7 to January 5.
Thanks to big snowfalls this winter and more snow just last week, a 2.5
metre snow base remains at Knoll Ridge (2000m), enabling the Ski Area to
offer summer skiing.
by Bob Foster1
bclim10, 14/12/2002
1. A REPUTATION WORTH PROTECTING
A review by Paul Adam in The ANZAAS Mercury (September 2002, p 5) of “Fields
of Discovery: Australia’s CSIRO” by Brad Collis (Allen & Unwin, 520 p)
begins:
The CSIRO is one of the jewels in Australia’s crown. It is
an extraordinarily diverse and productive research organization, and
the national public face of science. In many countries public
statements from government scientists tend automatically to be regarded
with suspicion and scepticism. In Australia CSIRO is a trusted umpire,
and endorsement by the organization is a high accolade.
It takes decades to earn a reputation like this.
2. CSIRO’S TEMPERATURE PROJECTIONS FOR AUSTRALIA
CSIRO’s website www.dar.csiro.au/impacts/future tells us that: By 2070, annual
average temperatures are increased by 1.0 to 6.0 OC
over most of Australia ... because of human-caused greenhouse gas (GHG)
emissions. For the “inland”, the new (8/5/2001) projection is an
even-more-remarkable 1.0-6.8 OC – cf ‘only’
0.7-3.8 OC in CSIRO’s last (1996) report.
I promise I am not making this up: now, CSIRO has Darwin going from the present one December-February day per year over 35 OC on average, to a whopping 5-79 days by 2070. CSIRO could be quite right, of course; but no-one today has any way of knowing. Think the unthinkable: is CSIRO snowing us on future Australian warming?
3. CLIMATE CHANGE AND THE NATURAL SCIENCES
3.1 Did the ‘Greenhouse Effect’ cause 20th-Century warming?
In the 20th Century, 0.6 OC of global-average
surface warming from all causes occurred in two episodes: from the 1920s to
the mid-40s, with the balance from 1976 onward - and with a return to slightly
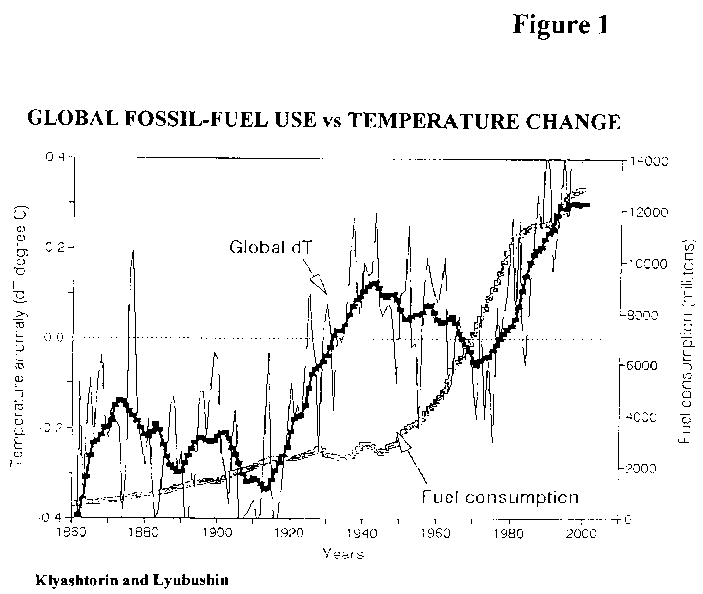
cooler conditions in the interim. Figure 1
compares world consumption of carbon-based fuels (a good surrogate for GHG
emissions) with the observed increase of globally-averaged surface temperature.
Clearly, the first warming episode from the 20s largely predates the growth
of human-caused GHG emissions to the atmosphere.
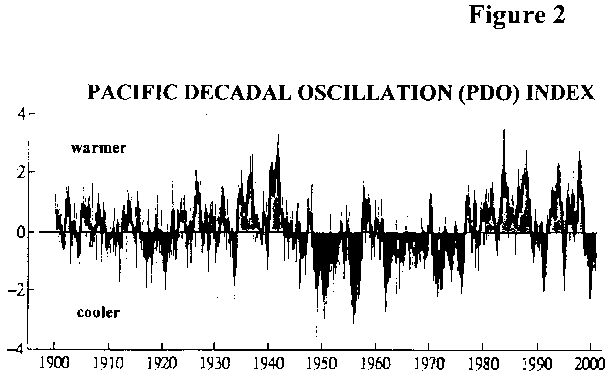
The Great Pacific Climate Shift of 1976/77 was the climatic event of
the century. This Shift coincided with an abrupt reduction in the
upwelling of cold water in the eastern Pacific, as recorded by the Pacific
Decadal Oscillation (PDO) Index (Figure 2)
- which shows reductions during the 1920s-40s and 1977-98. The impact
of the 76/77 Shift extended far beyond PDO and the Pacific; and its global
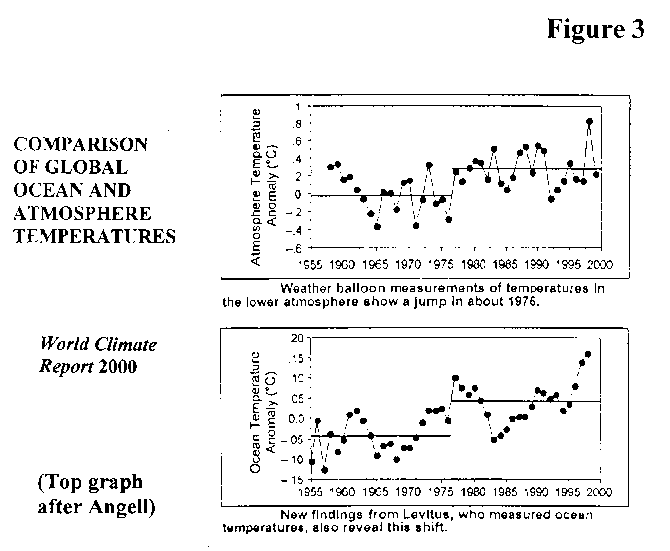
influence on atmosphere and oceans is illustrated in Figure 3. Selected examples of its physical
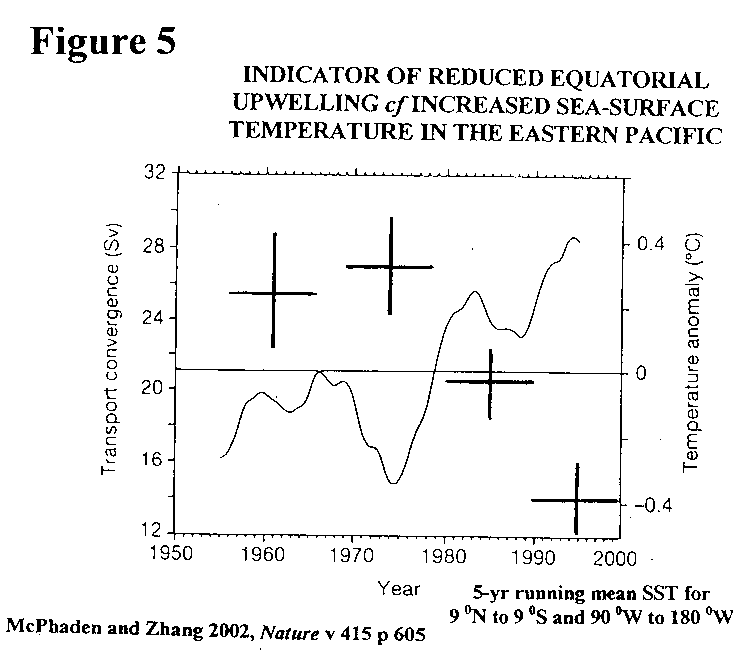
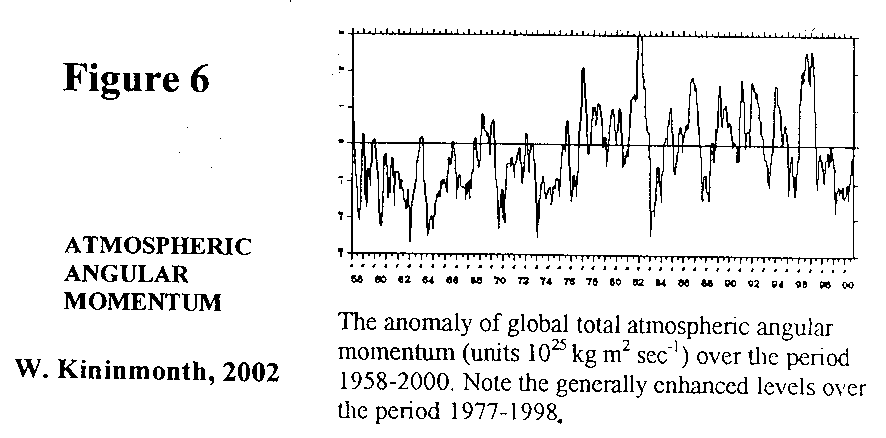
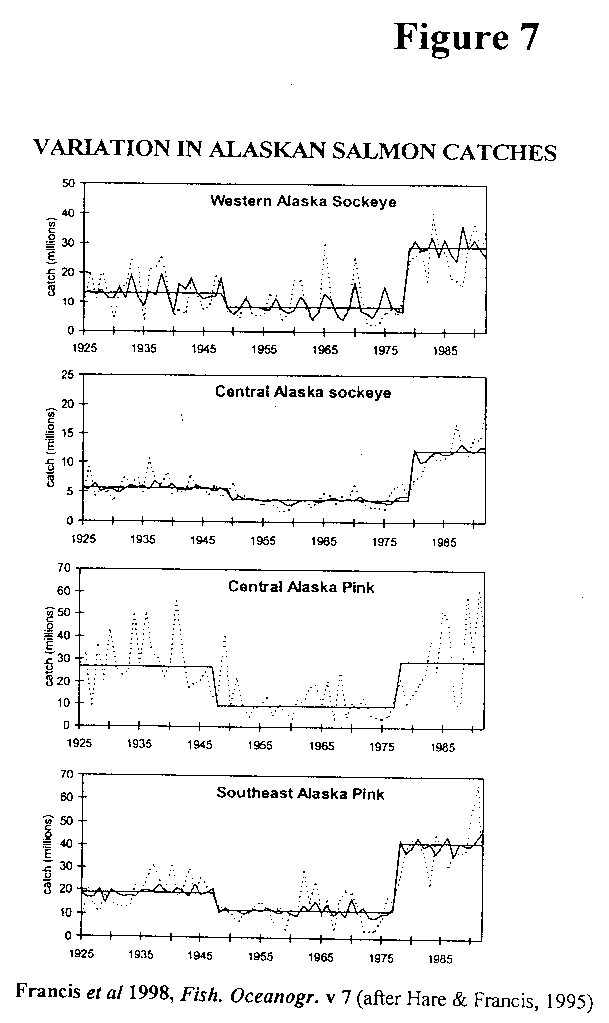
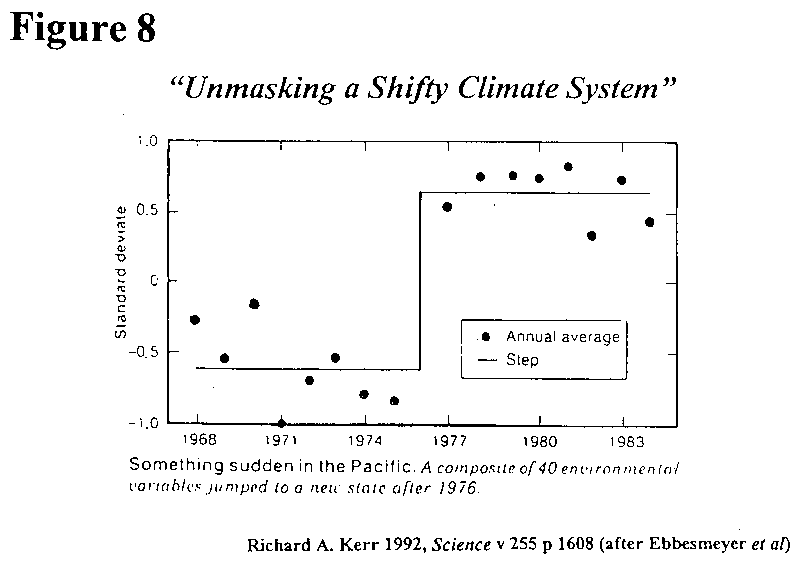
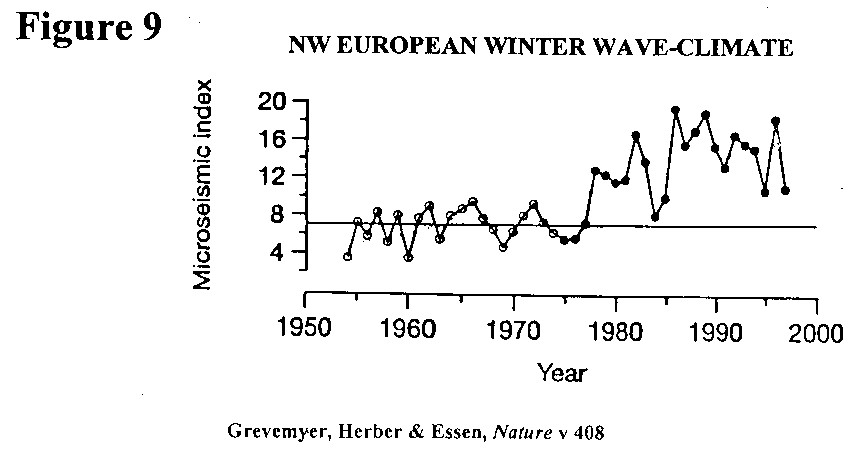
and biological influence are given in Figure 4,---Figure 5,---Figure 6,---Figure 7,---Figure
8, and Figure 9.
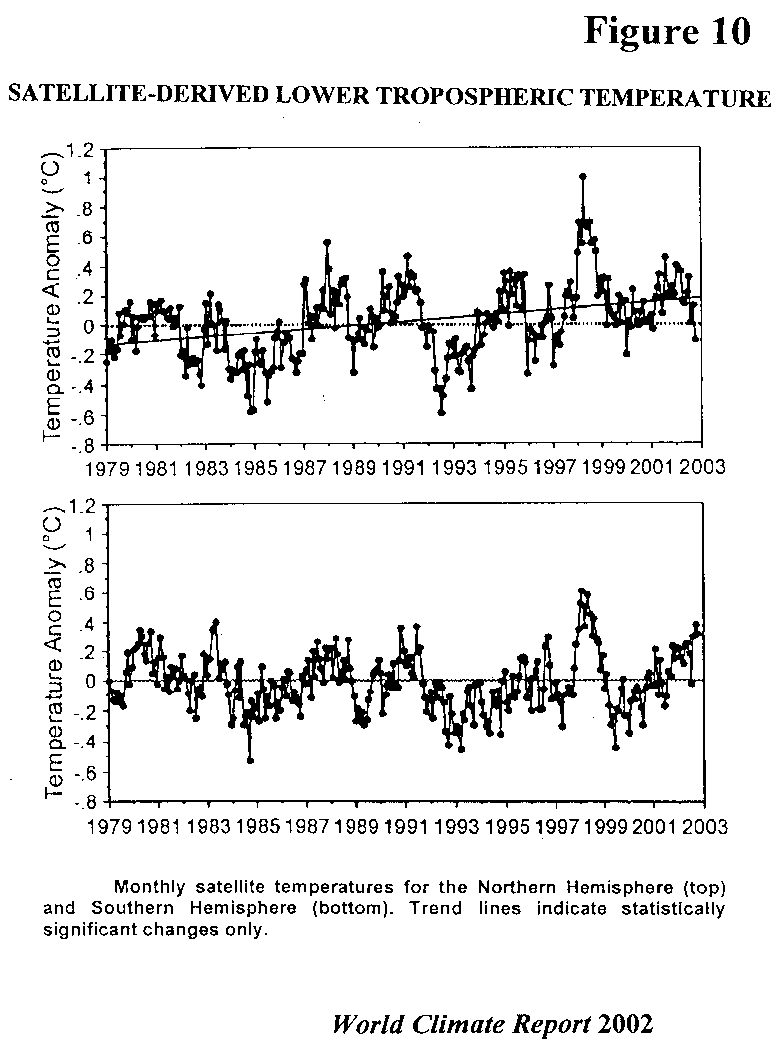
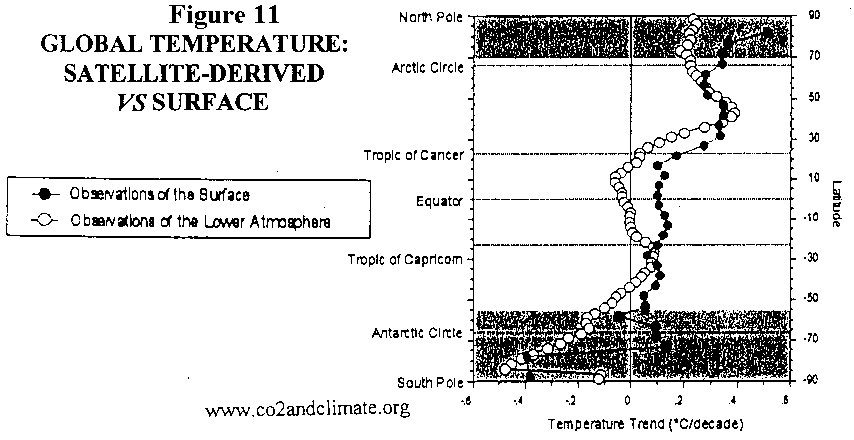
We now have 23 years of global coverage from satellite-derived observations to supplement the weather balloon record (top graph in Figure 3), which is only adequate in the Northern Hemisphere - better over land, best over Europe and North America. There are two surprising findings. The lower troposphere is only warming a quarter as fast as is the surface, and (in the tropics, at least) more – not less – heat is leaving the top of the atmosphere for Space. The simplest explanation for these findings is that most of the measured surface temperature increase over the past 23 years is something other than ‘greenhouse effect’ warming.
During this period, the lower troposphere of the Southern Hemisphere appears not to have warmed (Figure 10---Figure 11). In fact, most warming in the lower troposphere is north of 30ON; and south of 45 OS is cooling. Therefore, any human-caused greenhouse warming (i.e. at the surface) to date, would be largely confined to the extra-tropical Northern Hemisphere.
And yet, CSIRO is warning us that Australia could warm ten times as much by 2070 - from the greenhouse effect alone - as the global-average warming from all causes over the last 100 years. To me at least, this sounds more like advocacy than umpiring.
3.2 Palaeoclimatology and the cause of contemporary climate change
Let’s look at the past for guidance. Global climate is cyclic (warmer/cooler)
at many time-scales – although CSIRO’s modellers admit only to warming in
future. Since the final cold snap of the Little Ice Age, the Dalton
Minimum from 1800 (the last of the Great Frost Fairs on the Thames was in
1813/14), we had rebound in the 1820s and warming peaks in the 1870s, 1930s
and 1990s. These warmings are overprinted on a longer warming trend
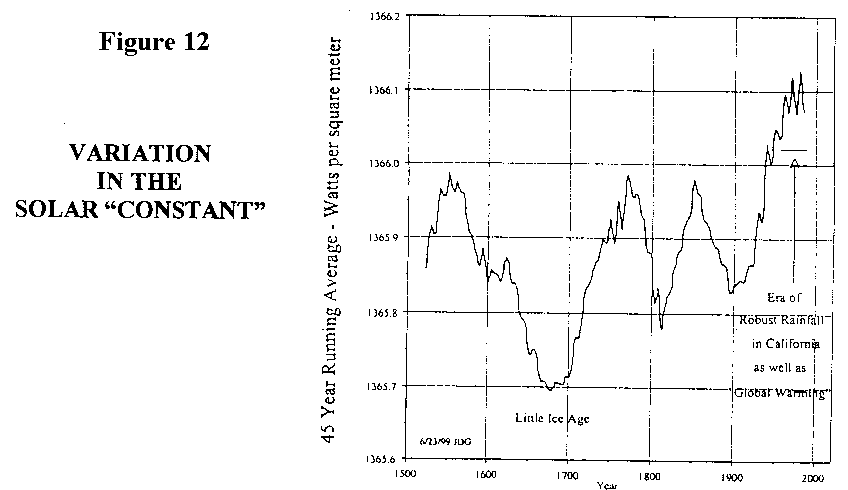
which goes back to the Maunder Minimum at about 1650-1700 (insolation was
lower then, see Figure 12).
During the Great Winter of 1683/4, when 11 inches of ice formed on the
River, diarist John Evelyn (here copied from Museum of London) wrote:
Streetes of Boothes were set up upon the Thames, which were like
a Citty or Continental faire, all sorts of Trades and shops furnished,
and full of Commodities, even to a Printing presse …
The long-running (at least 200,000 years) 1500-year cold/warm cycle, of which the Roman Empire Warm Period, Dark Ages, Mediaeval Warm Period and Little Ice Age are the latest manifestations, is closely linked to solar influences.
But the overprinted 50/60-year cycle of global temperatures is related in the first instance to inertial factors, as evidenced by cyclic changes in length-of-day which display a strikingly similar period; and the same period applies to the cycle of change in the movement of atmospheric and oceanic mass – and hence in heat transportation. Again, the Sun may well be involved, although we don’t yet know how – but there is no ‘greenhouse effect’ signature in evidence. Just a thought: this cycle has persisted for several hundred years now; and if it were to continue, 1999-2016 should become its cooler next phase.
4. CLIMATE PROJECTIONS AND THE SOCIAL SCIENCES
4.1 All the way with IPCC
Why then did CSIRO increase its high-end projection of Australian warming
in 2070? Because it adopted, as starting point for its regional modeling,
the global averages projected by the United Nations Intergovernmental Panel
on Climate Change (IPCC). Between its Second (1996) and Third (2001)
Assessment Reports, IPCC increased the high-end of its warming range for 2100
from 3.5 to 5.8 OC. In response, CSIRO
increased its high-end (global) rise for 2070 on a pro-rata basis, from 2.1
to 4.0 OC.
Misleadingly, CSIRO tells us that:
This faster rate of warming was mainly due to changes in the emissions
of sulphate aerosols between the two sets of scenarios. Emissions
of sulphate aerosols, which have a cooling effect on climate, were
projected to increase strongly in the (IPCC 1996) scenarios, but these
increases were much reduced in the (IPCC 2001) scenarios.
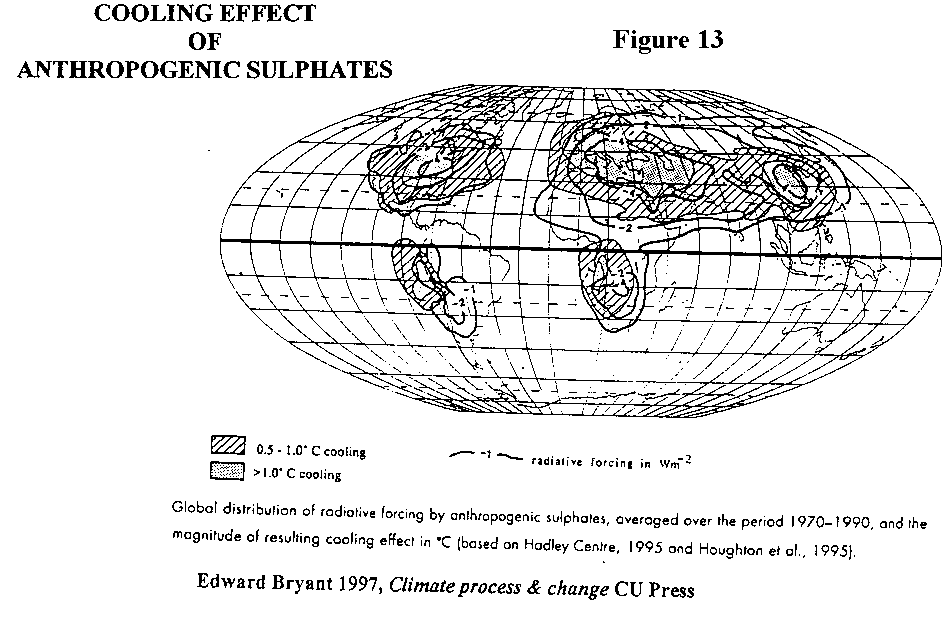
This explanation is highly implausible. The first draft of IPCC’s new Report (Climate Change 2001: the scientific basis) released in 1999, already included the changed assumptions for cooling aerosols, and the high-end projection for 2100 rose then only from 3.5 to 4.0 OC. In any case, the aerosol explanation is contradicted by the observed pattern of warming. Roughly 90% of these short-lived aerosols (Figure 13) are emitted in the Northern Hemisphere – where most fossil fuels are burned. But the warming is in the same hemisphere. (Indeed, Australia emits negligible ‘cooling’ sulphates - whose future elimination might otherwise have given a boost to projected regional warming. CSIRO is already in over its depth.)
However, the global 5.8 OC did not surface until the final draft of October 2000 – subsequent to review by government representatives. The key post-science changes appear to be:
First, the inclusion of a high-end scenario (A1F1, see below)
which incorporates an extremely high use of fossil fuels;
Second, the addition of a 30% allowance (about 300 ppm) to the
high-end projection of atmospheric CO2 concentration to
cover “uncertainties”; and
Third, the substitution of the single climate model (incorporating
IPCC’s ‘best- estimate’ sensitivity to increasing CO2 concentration)
by a suite of models having various sensitivities - including one with
a particularly high sensitivity.
The assertion that the jump from 3.5 to 5.8 OC results from the new assumption of lower sulphur dioxide emissions in the future appears not to be true.
4.2 Reliance on IPCC’s economics
IPCC’s climatic outcomes arise from its Special Report on Emissions Scenarios
(SRES), and are based on six ‘storylines’ containing demographic and economic
projections, leading on to 35 ‘scenarios’ for human-caused greenhouse gas
emissions, and thence to 245 temperature ‘projections’ from runs in seven
numerical models covering a wide range of sensitivities.
One “marker” storyline (A1) assumes rapid growth in economic activity,
coupled with a fast rate of convergence in per-capita wealth between the world’s
regions. One scenario (A1F1) has this growth powered to an extreme
extent by energy derived from coal. This scenario, applied to the most
sensitive climate model, yields the projection of 5.8 OC global-average temperature rise between 1990 and
2100. Hence, the plausibility of CSIRO’s projected warming for Australia
in 2070 is crucially dependent on the plausibility of the underpinning assumptions
for IPCC’s economic models. This is social, rather than natural,
science.
It is hard to imagine, I know; but CSIRO appears to have taken IPCC’s economic
modelling on trust. Crucially, it did not seek independent expert corroboration
- although not one of the 53 authors and 75 reviewers for the SRES projections
is based in Australia.
4.3 Analysis by Ian Castles
Ian Castles (Visiting Fellow at the ANU National Centre for Development Studies,
and former Australian Statistician) has dissected IPCC’s “equally sound”
storylines. All are unsound, he finds (but not equally so),
because the SRES authors made a fundamental error.
SRES converted all nations in the base year (1990) to a common measure of per-capita wealth, using quoted currency exchange rates. This mistake made economies in the developing world appear too small in 1990; and hence, they were required to grow by too much in order to reach their designated future level of GDP-per-capita parity with the developed world.
As an example, compare electricity consumption in Japan and China. When the Chinese electricity tariff in Yuan, and the Japanese in Yen, were converted to the common currency of the study (US dollars), the Chinese tariff was only a tenth that in Japan on a kWh basis. On a USD basis, China was (wrongly) shown to have a lot of catching up to do – an error by a factor of ten. If SRES had instead used purchasing power parity (PPP) for calculating base–year equivalence (i.e. kWh not USD for electricity), much less economic growth would have needed to be projected in the SRES storylines.
4.4 IPCC’s high-end projection of 5.8 OC
When correctly recalculated by Castles (using PPP), the most optimistic SRES
storyline (A1) implies an “unimaginable” 35-times growth in whole-world per-capita
wealth between 1990 and 2100. In sharp contrast, it was only 5 times
in the past century - and even the Land of the Rising Economy, Japan, failed
to reach 20 times. But projected growth is not evenly distributed;
and A1 invokes 140 times for developing Asia (excluding Japan, Iran, and
the Former Soviet Union). Even for the rest of the developing world
(Latin America, Africa and Middle East), growth will be nearly 30 times.
The good times are coming - for everyone.
Global CO2 emissions from fossil-fuel use (plus industrial processes) were about 6.1 billion tonnes in 1990, on a contained-carbon basis. Coal-intensive A1F1 has them rising steeply to 24 BT in 2050 and 30 BT in 2100. On a per-capita basis, historical carbon emissions peaked at 1.23 tonnes in 1979, and were down to 1.11 tonnes by 1999. A1F1 has over 4 tonnes by 2100; and this scenario assumes cumulative coal use by 2100 far beyond the exhaustion of currently-known reserves. But the writing is already on the wall for A1F1, because it had coal consumption growing 31% between 1990 and 2000. In reality, it grew less than 1%.
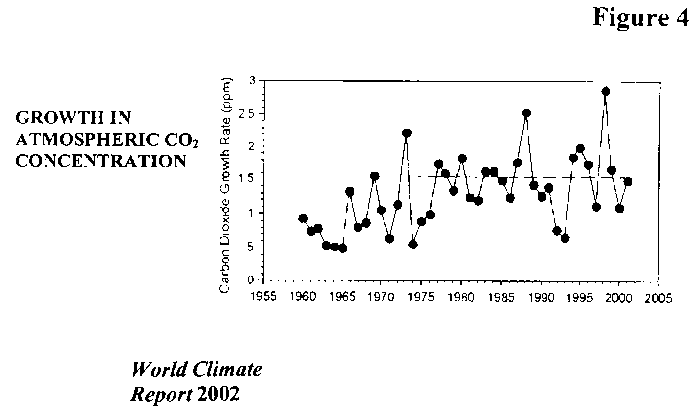
The atmospheric concentration of CO2 has been growing at about 1.5 ppm per year for the past two decades and more. It is now 370 ppm (compared to a pre-industrial 280 ppm), with no sign of acceleration. A1F1 has it at 960 ppm plus 300 ppm for uncertainties, to yield the extremely implausible 1260 ppm by 2100 on which the high-end projection relies. Even 1998, the year of the vast peat fires in Kalimantan (Figure 4), didn’t come close to the 9 ppm/year average increase which is needed to make 1260 ppm a reality.
Atmospheric concentration of methane, the second most important anthropogenic greenhouse gas, has grown at a decreasing rate for more than a decade; and in 2000, the concentration fell. It is now about 1750 ppb; although A1F1 envisages an implausible 3400 ppb by 2100.
4.5 IPCC’s low-end projection of 1.4 OC
Castles points out that the bottom of IPCC’s projected range (from a B1 scenario)
has been widely interpreted as marking the lower bound of probabilities.
The higher-efficiency and hence lower-emissions B1 “marker” storyline, while
assuming slower economic growth in the currently-wealthy nations (5 times)
between 1990 and 2100, still has per-capita wealth in developing Asia growing
by an implausible 70 times. SRES says:
The scenarios of rapid development and “catch-up” (A1, B1) remain
in dispute within the SRES writing team because they imply rapid productivity
growth. However, it is agreed that such scenarios of high productivity
growth … cannot be ruled out, even if they are certainly very challenging
from the perspective of recent growth experience in a number of regions,
most notably Africa.
The SRES authors acknowledge that growth rates lower than assumed in the B1 scenario-group are not only possible, but likely. Thus, IPCC’s 1.4-5 8 OC ‘range’ is not a range at all.
For the developing countries (including Africa), IPCC’s low-end temperature projection stems from a per-capita wealth increase during the half-century from 1990 of nine times – averaging 4.5% per year. But the World Bank’s 2001 Global Economic Prospects report offers three (PPP-based) cases for developing countries to 2015 – 1.5%, 2.2% and a “best case” of 3.7%. The range of economic outcomes which CSIRO has adopted, and the range which World Bank envisages, do not even overlap. There is daylight between them!
4.6 CSIRO’s ‘range’ for 2070: ignorance not malice
CSIRO may well have been naive and inexpert; but no, it has not deliberately
snowed us. Instead, it appears to have been itself utterly confused
by IPCC’s SRES storylines.
However, IPCC’s problem goes beyond spurious economics, and implausible CO2 emissions growth thus resulting. Equally implausible is its autistic fixation with human-caused greenhouse gas emissions as driver of 20th Century climate change. This leads on to IPCC’s strictly-unidirectional model-based projections of climate over the next century - which CSIRO has uncritically adopted for its 2070 global-average starting point, and then elaborated to achieve its own regional projections.
5. POLICY-MAKING IN THE WEST
There is a good chance that CSIRO’s worthless projections are being used
right now as guidance by unsuspecting policy-makers; for instance, The
West Australian in a report (8 October 2002, p.10) by Peter Trott, said:
Clamps on greenhouse gas emissions proposed in the Kyoto Protocol
would not prevent a grim scenario of lower rainfall and higher temperatures
across southern Australia, a leading CSIRO scientist told the State
Water Symposium yesterday.
CSIRO atmospheric science division head Graeme Pearman said Kyoto
emission limits would be insignificant in averting global warming.
A 50 per cent cut in greenhouse gas would be needed to reverse the
trend which had seen a one-degree rise in the past century.
This represented 10 percent of the total temperature change since
the last ice age. The significance of greenhouse gases, which
were expected to drive up temperatures 1.4C to 5.8C by 2100, meant
the energy used to supply water would in future have to come from reusable
sources.
This bone was not left unworried for long. In the ABC 7.30 Report on
25 November, Dr Pearman continued:
The rainfall in the south-west, the extreme southwest, has been
reduced by 30 per cent to 40 per cent, on average, for the past 25
years.
So they have a problem that’s not going away.
Something is wrong here. There are three stations belonging to the Bureau of Meteorology “high quality rainfall data set” situated in the SW – Cape Naturaliste, Kendenup (Mt Barker) and King River (Albany). Compared to 1904-1976, rainfall for 1977-2001 is certainly down –by an average 5%. Some other places (e.g. Perth, 11%) are more than 10% down, but there is no 30 or 40% - or 20%. Just to the NE, in the adjacent Wheat Belt, increases above 20% are common – see Warwick Hughes’ http://au.geocities.com/perth_water for more.
6. SHOULD CSIRO COME CLEAN?
In fairness to IPCC, it warns explicitly against the misuse of its 1.4-5.8
OC projections for the purpose of policy-making.
Sagely, it cautions:
No judgment is offered … as to the preference for any of the scenarios
and they are not assigned probabilities of occurrence, neither must
they be interpreted as policy recommendations.
In view of both this pre-existing stricture, and Ian Castles’ exposé of the flawed social-science underpinnings to IPCC’s ‘scientific’ projections, now is the time for CSIRO to warn both policymakers and public that its widely-disseminated 2070 regional temperature projections for Australia should be permitted no role whatever in the formulation of policy.
This is a big ask. But retreating into denial will not do, because preparing and publicizing CSIRO’s fatally-flawed projections involved the expenditure of public funds – i.e. taxpayers’ money. Besides, CSIRO has a reputation to protect.
7. HANDS-ON CONTROL OF GLOBAL CLIMATE
Renouncing the search for “Policy Options for Stabilizing Global Climate”
(the title of the 1989 Report to Congress by the United States Environmental
Protection Agency) might be an even-bigger ask. As you will recall,
CSIRO (see Section 5, above) is reported as saying:
A 50 per cent cut in greenhouse gas would be needed to reverse the
trend which had seen a one-degree rise in the past century.
By implication, there has to be another side to this coin. What would
it say? It might go something like this:
If it were not for the fossil fuels humans have been burning since
the Industrial Revolution, the warming trend seen in the 20th Century
would never have happened, and Londoners would still be enjoying Frost
Fairs on the Thames in winter.
But there is a vast array of earth-science-based observational/deductive evidence contradicting any such nonsense - whose only substantial support derives from the atmospheric-science-based numerical models which IPCC invokes.
Admittedly, UK Prime Minister Tony Blair said in Mozambique (1 September
2002): We can defeat climate change if we want to. But that comforting
belief is implausible now, and will remain so for the foreseeable future.
This is politics, not science.
CSIRO has scientific carriage of this fundamental issue on behalf of
Australians; and it needs to rethink its position in the light of the accumulating
physical (i.e. not just model-derived) evidence. CSIRO would do us
all a service if it could now tell Australians that no amount of ‘doing the
right thing’ about GHG emissions can stabilize global climate.
Whether held by the US EPA, Australia’s CSIRO, or the British PM, sincere belief in the feasibility of hands-on control of climate – no matter how vehemently held - is not enough. We humans can’t control climate; and mitigating the impact of both climate change and extreme weather events is the only course currently open to us. I look forward to CSIRO taking the intellectual lead in Australia on this scientific issue - by saying just that.
8. AUSTRALIA NEEDS A CLIMATE UMPIRE – BUT IT ISN’T
CSIRO
Contrarians might arouse scepticism among the convinced by saying that:
Atmospheric CO2 is a not a pollutant, but a vital plant
food (hence the addition of CO2 to commercial greenhouses).
Furthermore, as an important extra benefit, increasing concentration
enables plants to use the available water more efficiently.
and
A thousand years ago, Norse colonies thrived in Greenland - only
to be extinguished by onset of the Little Ice Age from about 1300AD.
Human-caused emissions can explain neither the Mediaeval Warm Period,
nor the warming-trend since the depths of the LIA at 1650-1700AD.
Similarly, the 20th Century warming during the 1920s-40s, and its abrupt
renewal from 76/77 appear not to be the ‘greenhouse effect’. In fact
from 1979 onward, the satellite record provides ever-strengthening
support for this conclusion.
Are Australians just as alert to special pleading when hearing from those
on the side of the Angels? Back in 1989, Dr Rajendra K. Pachauri (who
has recently succeeded Dr Robert Watson as Chairman of IPCC) was instrumental
in the issuance of this remarkable statement:
Global warming is the greatest crisis ever faced collectively by
humankind. Climate changes of geological proportions are occurring
over timespans as short as a single lifetime, and this may threaten
the very survival of civilization.
While, happily, its words aren’t quite as purple as those above, CSIRO
is also advocating the catastrophist line - as in the following example (ABC
Sci-Tech, 31 May 2002):
The CSIRO says the evidence is overwhelming that global warming
is the result of human activity, and will continue to accelerate if
nothing is done.
Climatologist John Church has told a conference on renewable energy
at Coffs Harbour, that the 1990s was the hottest decade of the warmest
century in 1,000 years.
However, he says the increases are small compared to what could
happen in the next 100 years.
and
He says there is little evidence to justify the view that the jury
is still out on global warming.
“There are very few credible sceptics out there,” Dr Church said.
Is this our “trusted umpire” speaking? If not, who will prioritize for Australians the dubious threat of future human-caused warming against (for instance) the real-life, here-and-now, threat to biodiversity posed by continued clearing on a vast scale in our region: Sumatra, Kalimantan, New Guinea and the lesser Melanesian islands – and Queensland?