Sydney water supply catchment region long term rainfall history

To keep the front page tidier this page can present a wider variety of rainfall and related data.
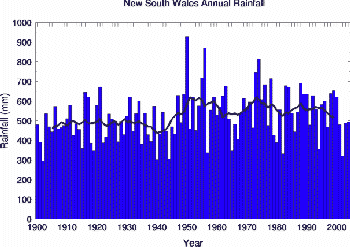
I understand CSIRO has told the NSW Govt that since 1950 NSW rainfall has been declining at 14.3mm per year and the Premier Bob Carr has been impressed enough by this statistic to quote it late in 2004.
One can only marvel at how a "flagship" scientific organisation can quote rainfall statistics so selectively to non-scientific policymakers.  Echos of Perth here.
NSW rain history from the BoM
It just so happens that 1950 was the standout highest year in the NSW rainfall record, at 930.15 on the Bureau of Meteorology (BoM) web site, see the BoM graphic.  So to use that year as a starting point of course a decline will be shown, which is very misleading unless policymakers are also well aware of the statistical implications of the full dataset, that choosing slightly different starting points can give very variable results.
A fair statement about the NSW trend from 1900 could be that after abnormally wet years from the end of the 1940's to the 1970's we have returned to a more normal rainfall pattern similar to the 1900 to 1945 period.
The graphic below has ironic relevance to the misleading CSIRO claim re fall off in rain post 1950 in NSW. 

NSW rainfall anomaly 1947 to 74
From the late 1940's to 1974 there were 6000 aircraft hours of cloud seeding experiments carried out over SE Australia.  The graphic below maps the rainfall anomaly  for those years.
So it is possibly that the much maligned cloud seeding experiments contributed to the high rainfall year of 1950 which CSIRO then use in a misleading way to convince the NSW Govt that future rain prospects are grim.
You could hardly write a better black comedy plot.
This map comes from a 2002 report by Ian Searle submitted to
"The House of Representatives Standing Committee
on Agriculture, Fisheries and Forestry Inquiry into Future Water Supplies for Australia’s Rural Industries and Communities." I can email a copy if you can not find using Google.


A look now at Cataract Dam rainfall monthly data.
Cataract Dam monthly rain 1904-2004
This graphic demonstrates how much of Sydney rainfall comes in relatively few scattered high rainfall months.  Rainfall which has now been characterized as "freak" by Tim Flannery.  Wonderful, a century long repeated natural phenomenon now is "freak".

Back to main Sydney rainfall & water resources page