Sea Surface
temperatures (SST's)
Much is made by IPCC supporters that SST's
reinforce the Jones et al land trends.
The facts are that a decade and a half ago Jones et al began adjusting
SST's to fit trends in coastal grd boxes.
Here is a 1992 quote from a prominent climate scientist and IPCC author.
"Moreover,
the "observational"
records of sea surface temperature actually are affected by urban
heating ! What has happened is that Jones and others in the UK
adjusted ocean temperatures to coastal values when the two differed."
He goes on to note. "Without this adjustment, IPCC estimates of
global
warming over the past century would have been reduced from the
relatively small 0.45C + or - 0.15C to the even smaller 0.32C + or -
0.15C -- a trend that isn't much different from zero."
The
1984 paper Folland, Parker and Kates Worldwide marine
temperature fluctuations 1856-1981, Letter to Nature, Vol 310, 23 Aug
1984, page 670-673. (FP&K), shows graphically the huge
inhomogeneities in SST raw data.
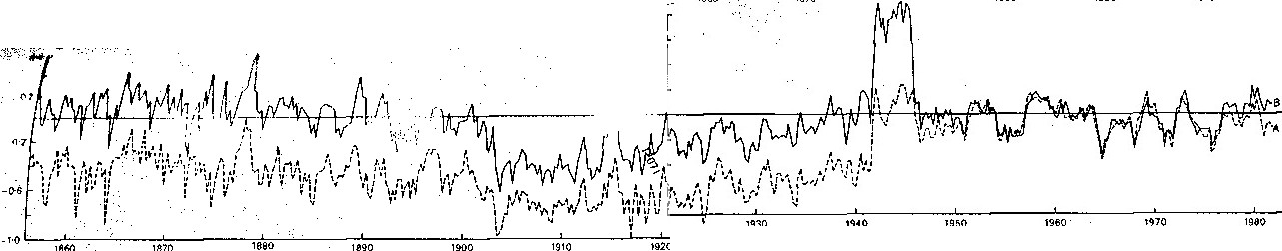
The
attached Fig 2 out of FP&K 1984 illustrates uncorrected
anomalies in panel above and shows neatly the huge "corrections"
required in SST's around WWII.. (Excuse ancient
photocopying). Note in both graphics A is SST trend,
B is Nighttime marine air.
With such huge and poorly understood inhomogeneities you could not
place great confidence in any trend derived from SST's over the full
period of data.
The FK&P original had the graphs broken at 1920, I have spliced
them to a continuous trend.
The Corrected anomalies are below. A and B are the same as above.
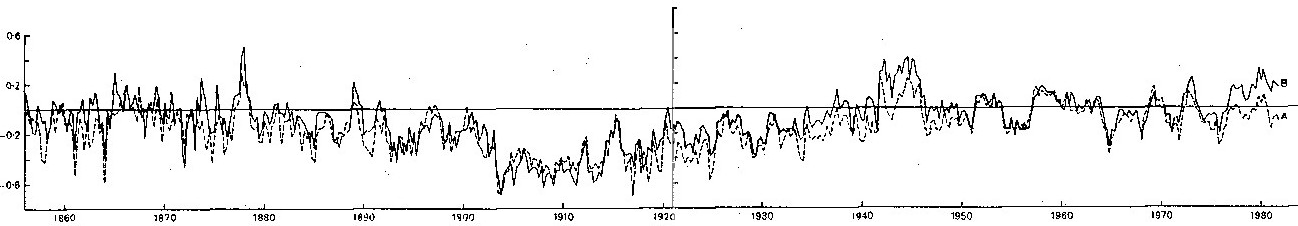
Notice how slight any trend must be over full timescale and how the
late 19C is on a par with the warmth of recent times..
Closer to nailing another IPCC lie.
There are early US SST trends by Oort and also Newell which I keep an
eye out for.