Atlanta Olympic Games Ozone levels
in Air and Asthma Rates.
3 August 2004 (starting at the bottom of the page readers can see
my previous postings exploring the data relevant to the claims linking reduced
asthma to reduced ozone due to reduced traffic)
Claims have been given wide creedence on the internet that asthma
was reduced in Atlanta during the Olympic Games of 19th July to 4 August
1996 due to reduced traffic lowering air pollution, see downloadable pdf
report at; http://www.eere.energy.gov/cleancities/conference/2001/pdfs/Michael_Friedman.pdf
The above presentation is based on a paper originally published in 1999
in the Journal of the American Medical Association (JAMA)
Another view by University of Georgia Professor Emeritus Harold Brown
pointing out weaknesses in the connection can be found at; http://www.gppf.org/article.asp?RT=19&p=pub/AirQuality/envurbanmyth040716.htm
Dr John Ray's weblog http://antigreen.blogspot.com/ on 19 July 2004
has drawn attention to this issue so I wanted to see what the data shows,
ideally I want to analyse hourly ozone, temperature and whatever
other air monitoring elements available for say June to August 1996. All
my ozone data analysis experience tells me that big city summer ozone peaks
will be broadly influenced by daytime max temperature and met factors such
as wind; I would be sceptical that a slight decrease in vehicle emissions
could dominate over these more important factors.
 The Georgia Dept for Natural Resources runs air monitoring in Atlanta and
their web site has this graphic full size at; http://www.air.dnr.state.ga.us/tmp/olympic_ozone/index.html
The Georgia Dept for Natural Resources runs air monitoring in Atlanta and
their web site has this graphic full size at; http://www.air.dnr.state.ga.us/tmp/olympic_ozone/index.html
You can also click on a calendar and see hourly data for each day in the
Olympic period. There is no text to go with their graphic which
is for exactly the Olympic period and I can only assume that readers will
be left with the general impression that ozone levels were lowered during
the Olympics. Because it took a week or so to clear up with the Georgia
DNR exactly what station data they had sent me I sought data from other sources
that was relevant to the general problem and that is all posted from the
bottom of the page upwards in order of posting.
Luckily I was able to find hourly ozone and other air data for various
SE USA stations (see map left) from the web site of 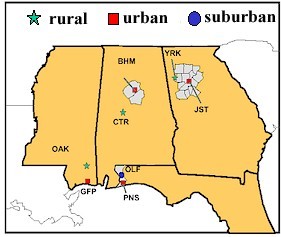 Atmospheric Research Inc which has a useful public database at http://www.atmospheric-research.com/public/index.html
but unfortunately no Atlanta data for 1996. Their JST site
is at Jefferson Steet in Atlanta. Luckily, 1996 ozone data is
available for Yorkville (YRK) a rural site 80 kms NW of Atlanta and
Centreville (CTR) a rural site in Alabama
3 August posting
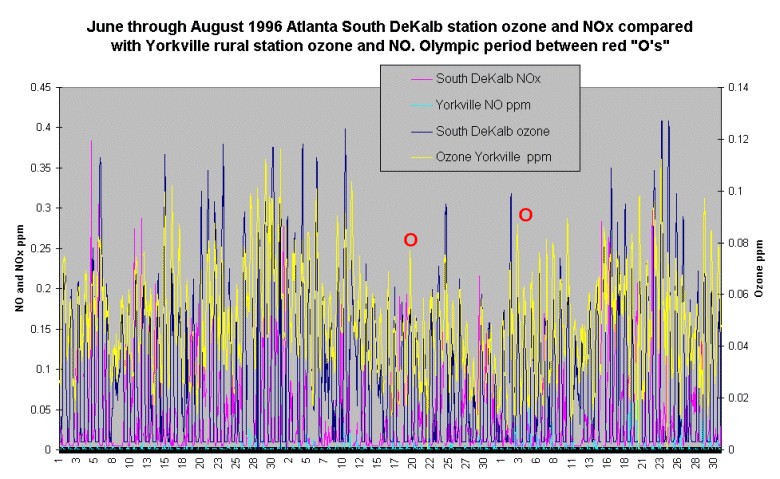
The graphic below shows ozone and NOx (NO for Yorkville) in the Olympic summer
of 1996 for South DeKalb station in Atlanta and rural Yorkville 80 kms NW.
As other data has shown(see 27 July below), the Olympic period was
typified by low ozone across a broad region and this also is the case for
South DeKalb. Traffic emissions for South DeKalb as represented by
NOx are wildly erratic and show no steady relationship with ozone. Yorkville
ozone daily peaks are often higher than South DeKalb yet Yorkville
NO is negligible compared to NOx in South DeKalb, which reflects the very
low traffic levels at Yorkville. Clearly ozone can often generate high daily
peaks without traffic. Another graphic just showing the Olympic period and ten days before and after.
South DeKalb wind speed is usually higher
when ozone is lower and vice versa.
It is clear that the politically correct notion that reduced Olympic traffic
caused lower asthma rates has no scientific basis that can be detected in
air monitoring data.
27 July 2004 The graph below shows clearly that across a broad region
of Georgia and Alabama the Olympic period happened to be characterized
by the lowest ozone levels of the 1996 summer. So you would have to
suspect that the lower ozone levels in Atlanta during the Olympics are also
following this regional trend which is no doubt due to broad scale meteorological
factors and nothing to do with traffic. I am still waiting to get
the 1996 summer hourly data from an Atlanta station from the Georgia DNR.
22 July, still awaiting the Atlanta June-August 1996 data covering the
Olympic period.
To keep ourselves busy we decided to compare data from a central Atlanta
station and a rural site 80 kms NW, Yorkville; taking ozone and nitrous
oxide numbers for August 2001, a cooler year with lower ozone similar to
1996.
It is strikingly obvious that Atlanta and Yorkville have broadly similar
daily ozone peaks, some days Yorkville even exceeds Atlanta !!!
This is despite much higher overall NO numbers in Atlanta, those car exhausts,
with several very high peaks.
Note the very high NO peaks do not shift the ozone peaks much, so it
is hard to see a strong relationship between NO and ozone. So
where does this leave the much trumpeted claim that a slight reduction in
traffic during the Olympics could have caused lower ozone levels ?
NO numbers for Yorkville are insignificant, just showing as the purple
trace along the bottom of the graph
When will the EPA's start telling the truth about urban ozone ?
21 July.
An analysis of Yorkville data downloaded from the Atmospheric Research
Inc web site shows a relationship between periods of low wind speed and
high ozone in the graph below. Note the periods of higher
ozone below around June 15, 22, 29 and August 16 (then wind data gap).
And the Olympic period 19 July to 4 August had several higher wind speed
days.
So it seems that the issue of what causes variations in ozone levels
is more complex than just considering exhaust emissions.
Although we were sent some 1996 data from the Georgia air monitoring
Department, the ozone numbers did not agree with those on their web site
so we are checking further.
Posted 20 July 2004
 On the Georgia Goverment air monitoring site I read a pdf Report for
2002 at http://www.air.dnr.state.ga.us/amp/ which had a graph of ozone
exceedences for the years 1993 to 2002 and it is obvious that I could test
out my idea of the influence of temperature on ozone levels by comparing
Atlanta summer ozone peaks and temperature for the high ozone year 1999 and
a low ozone year, 2001.
On the Georgia Goverment air monitoring site I read a pdf Report for
2002 at http://www.air.dnr.state.ga.us/amp/ which had a graph of ozone
exceedences for the years 1993 to 2002 and it is obvious that I could test
out my idea of the influence of temperature on ozone levels by comparing
Atlanta summer ozone peaks and temperature for the high ozone year 1999 and
a low ozone year, 2001.
Luckily I was able to find hourly data for Atlanta from the web site
of Atmospheric Research Inc which has a useful public database at
http://www.atmospheric-research.com/public/index.html
for SE USA air monitoring but unfortunately no Atlanta data for 1996.As
yet I have not found those 1996 data for central Atlanta I require but while
reading the
The graph below shows clearly the broad relationship between ozone peaks
and daytime temperatures, the warmer year 1999 is typified by higher
ozone daily peaks.

Back to Ozone
front page.
Back to WarwickHughes.com
front page.