Changes in surface albedo and related land use changes.
The twentieth century warming of 0.6 C: partitioning it into solar, land use, and greenhouse gas warming.
Between 1900 and 2000, the surface thermometers give a 0.6 C warming. IPCC models though claim for the observed increase in carbon dioxide from 290 to 370 ppm, the observed temperature rise should have been 0.5 to 1.5 C, so the warming is already on the low side even if all of it is attributed to AGHG warming.
The 0.6 C warming can be caused by many factors. The IPCC itself states half of it, or 0.3 C, may be caused by increases in solar brightness (e.g., Hoyt, 1979; Hoyt and Schatten, 1997; Willson et al., 2003).
Hansen et al. (2003) claim that 0.15 C of the warming is caused by soot on snow which is a land use change. Kalnay and Cai (2003) and others also point out that a substantial portion of the warming comes from land use changes. Indeed, the change in diurnal temperature range is consistent with urban heat islands and land use changes and inconsistent with AGHG warming (e.g., Collatz et al., 2000 ).
Just taking these studies, the 0.6 C warming could be partitioned as 0.3 C from the sun, 0.15 C from land use changes, and 0.15 C from other causes such as AGHG warming. A figure of 0.15 C implies a doubling of carbon dioxide concentration would lead to a warming of about 0.12 to 0.40 C, or far less than the IPCC model predictions. Numerous empirical studies have concluded that the warming from a doubling of carbon dioxide is only a few tenths of a degree (e.g., Idso, 1980; Lindzen et al., 1998).
Geographical distribution of the warming and lack of polar warming.
Using the MSU satellite data, Christy and Spencer (2004) state ??.there has been no net warming in the tropics over the past 25 years, while there is very slight warming in the southernmost third of the globe.? The MSU satellite data shows its largest warming in the mid-latitudes of the Northern Hemisphere (Christy et al., 2003). The IPCC models predict greatest warming at the poles and the least warming at the equator, so the geographical distribution of the warming is not consistent with the IPCC models.
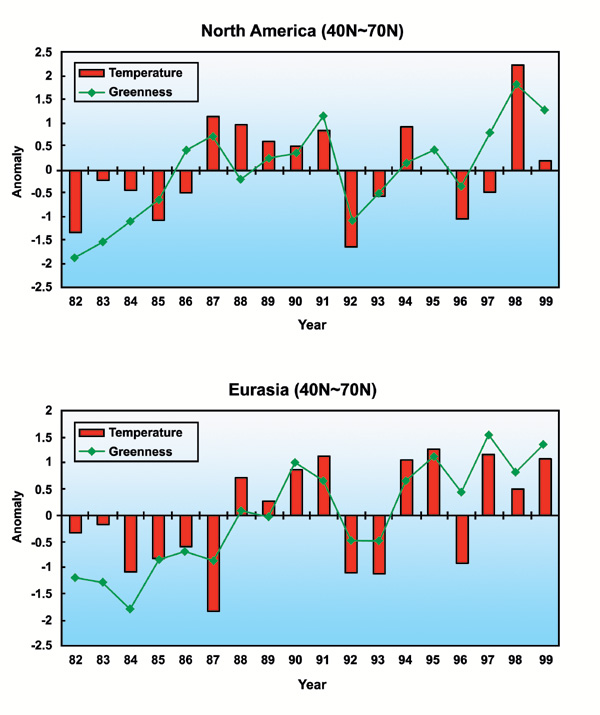
A better explanation for the geographical distribution of the warming shown in the figure above would be that increases in the Normalized Difference Vegetation Index (NDVI) in the same regions where the warming is being observed (e.g., Zhou et al., 2001). As the NDVI increases, the surface becomes darker leading to warming (e.g., Royer et al., 1997). It is a form of large scale land use changes and the largest areal extent for these changes is in the mid-latitudes of the Northern Hemisphere exactly where the greatest warming is claimed to be happening. The so-called global warming can be explained not only by these large scale land use changes, but also by uncorrected urban heat islands (e.g., Oke, 1973; Changnon, 1999; Torok et al., 2001), poor to non-existent quality control for the surface sensors (e.g., Davey and Pielke, 2004), and some warming due to a brightening sun (Willson and Mordvinov, 2003). These alternative explanations provide a better explanation for the geographical and diurnal changes in temperature than does the AGHG warming hypothesis. In fact, the decrease in diurnal temperature range cannot be explained by AGHG warming (Hansen et al., 1995), but is more likely explained by changes in land cover (Collatz et al., 2000).
Two figures from the US Climate Change Science Program
(http://www.usgcrp.gov/usgcrp/images/ocp2003/ocpfy2003-fig6-1.htm) illustrate that increased and darker vegetation in North America and Eurasia has lead to higher regional temperatures
Even worse for the IPCC models is the fact that there is no warming in the Arctic (Polyakov, I. et al., 2003) and the Antarctic (e.g., Comiso, 2000) has actually been cooling in recent years. Only about 2% of the Antarctic has been warming about the Antarctic Peninsula.
In summary, the IPCC models are not validated by the geographical distribution of the warming. Better explanations for the warming exist. In addition, the change in diurnal temperature range is inconsistent with greenhouse gas warming.
References:
Changnon, S. A. 1999. A rare long record of deep soil temperatures defines temporal temperature changes and an urban heat island. Climatic Change, 42, 531-538.
Christy, J. R. And R. W. Spencer, 2004. 25 years of satellite data show ?global warming? of only 0.34?. Press release, University of Alabama, Huntsville, AL (http://uahnews.uah.edu/scienceread.asp?newsID=196).
Christy, J. R., R. W. Spencer,
W. B. Norris, W. D. Braswell and D. E. Parker, 2003. Error estimates of Version
5.0 of MSU/AMSU bulk atmospheric temperatures. Journal of Atmospheric and
Oceanic Technology, 20, 613-629.
Collatz, G. J., Bounoua, L., Los, S. O., Randall, D.A., Fung, I. Y. and Sellers, P. J. 2000. A mechanism for the influence of vegetation on the response of the diurnal temperature range to changing climate. Geophysical Research Letters, 27, 3381-3384.
Comiso, J. C. 2000. Variability and trends in Antarctic surface temperatures from in situ and satellite infrared measurements. Journal of Climate, 13, 1674-1696.
Davey, C. A. and R. A. Pielke Sr., 2004: Microclimate exposures of surface-based weather stations - implications for the assessment of long-term temperature trends. Bull. Amer. Meteor. Soc., submitted.
Hansen, J., Sato, M. and Ruedy, R. 1995. Long-term changes of the diurnal temperature cycle: Implications about mechanisms of global climate change. Atmospheric Research, 37, 175-209.
Hansen, J., and L. Nazarenko 2003. Soot climate forcing via snow and ice albedos. Proc. Natl. Acad. Sci., 101, 423-428.
Hoyt, D. V., 1979. Variations in sunspot structure and climate. Climatic Change, 2, 79-92.
Hoyt, D. V., and K. H. Schatten, 1997. The Role of the Sun in Climate Change, Oxford University Press, 279 pp.
Idso, S. B., 1980. The climatological significance of a doubling of earth's atmospheric carbon dioxide concentration. Science, 207, 1462-63.
Kalnay, E. and M. Cai, 2003. Impact of urbanization and land-use change on climate. Nature 423, 528 - 531
Lindzen, R. S. and C. Giannitsis, 1998. On the climatic implications of volcanic cooling. J. Geophys. Res., 103, 5929-5941.
Oke, T.R. 1973. City size and the urban heat island. Atmospheric Environment, 7 769-779.
Pielke, R. A., Sr., J. Eastman, T. N. Chase, J. Knaff, and T. G. F. Kittel, 1998.
The 1973?1996 trends in depth-averaged tropospheric temperature, J. Geophys. Res., 103, 16,927?16,933.
Pielke, R. A., Sr., J. Eastman, T. N. Chase, J. Knaff, and T. G. F. Kittel, 1998. Correction to ?The 1973?1996 trends in depth-averaged tropo-spheric temperature,? J. Geophys. Res., 103, 28,909?28,911.
Polyakov, I. et al., 2003.
Variability and trends of air temperature and pressure in the maritime Arctic,
1875-2000, Journal of Climate, 16, 2067-2077.
Royer, A., P. C. S. Traore, N. O'Neill, K. Goita, N. Bussieres, 1997. Parametrisation globale du bilan d'energie a partir de la combinaison des parametres satellitaires albedo, NDVI et temperature de surface. Physical Measurements and Signatures in Remote Sensing, Guyot & Phulpin Eds., Balkema, Rotterdam, pp. 773-777.
Torok, S. J., Morris, C. J. G., Skinner, C. and Plummer, N. 2001. Urban heat island features of southeast Australian towns. Australian Meteorological Magazine, 50, 1-13.
Willson, R. C. and Mordvinov, A.V. 2003. Secular total solar irradiance trend during solar cycles 21-23. Geophysical Research Letters, 30.
Zhou, L., Tucker, C. J., Kaufmann, R. K., Slayback, D., Shabanov, N. V. and Myneni, R. B. 2001. Variations in northern vegetation activity inferred from satellite data of vegetation index during 1981-1999. Journal of Geophysical Research, 106, 20,069-20,083.
Addendum (added 12/14/04):
Greening of arctic Alaska, 1981–2001
http://www.agu.org/pubs/crossref/2003/2003GL018268.shtml
“Here we analyzed a time series of 21-yr satellite data for three bioclimate subzones in northern Alaska and confirmed a long-term trend of increase in vegetation greenness for the Alaskan tundra that has been detected globally for the northern latitudes. There was a 16.9% (+5.6%) increase in peak vegetation greenness across the region that corresponded to simultaneous increases in temperatures.”