What is going on at Climate Research
Unit (CRU), University of Norwich ?

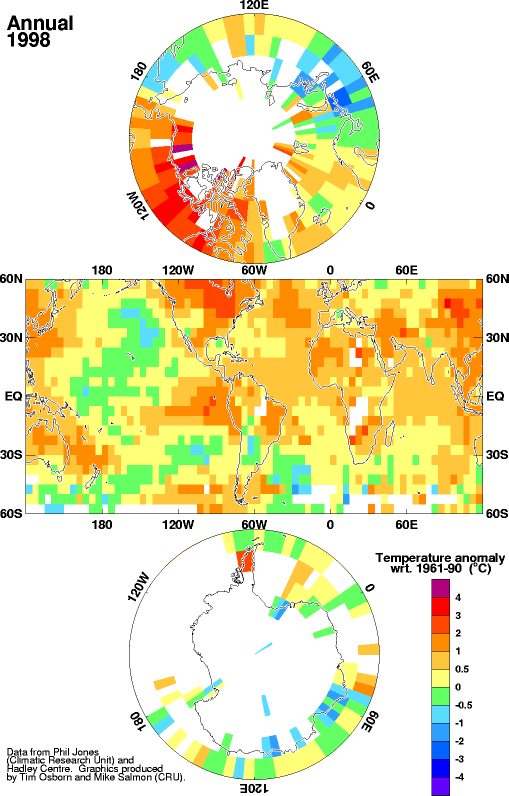
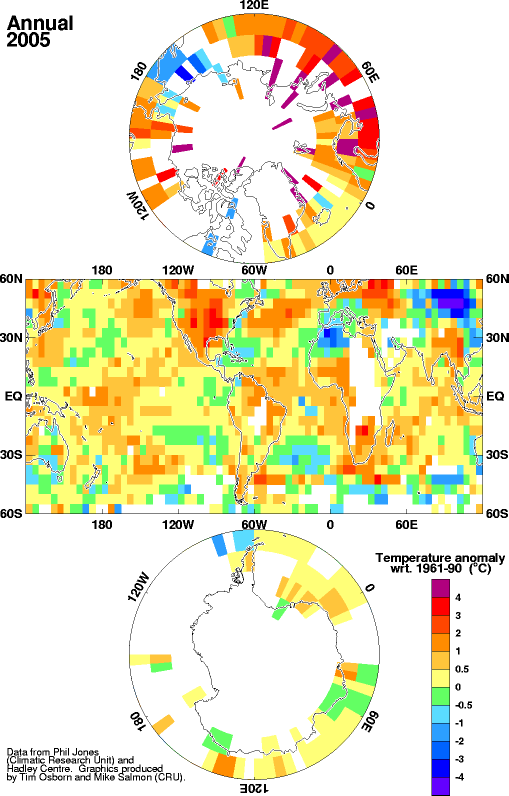
On 5 December I downloaded the following two panels of
Jones et al global grid box trends, 1998 and 2005 from the
CRU Climate Monitor pages.
At that time all monthly panels were completed up to October.

At the same time I downloaded (5 Dec) this graphic at left for
Jan to October 2005, all monthly panels were available up to and
including October.
In the last week I have checked the 2005 page and only January and
February monthly panels are present and the page bears a date stamp "Last
updated: 3rd April 2005", which I believe to be altered and
wrong.
On the previous page showing all years from 1960 on, the date stamp
reads "Last updated: 18th December 2005", which I accept as
correct. The page header even says Data runs up to
October 2005. Following section of CRU web page copied on 19
December 2005. I have kept a
screen dump of the 2005 page with panels from March onwards missing.
Gridded Temperature
Data runs up to October 2005.
These diagrams are grouped by year:
Last updated: 18th December 2005 (CRU date stamp)
I think CRU smarties have just caught themselves out.
Obviously some revision is underway for their latest 2005 is Hottest
blah blah.
On the CRU front page http://www.cru.uea.ac.uk/
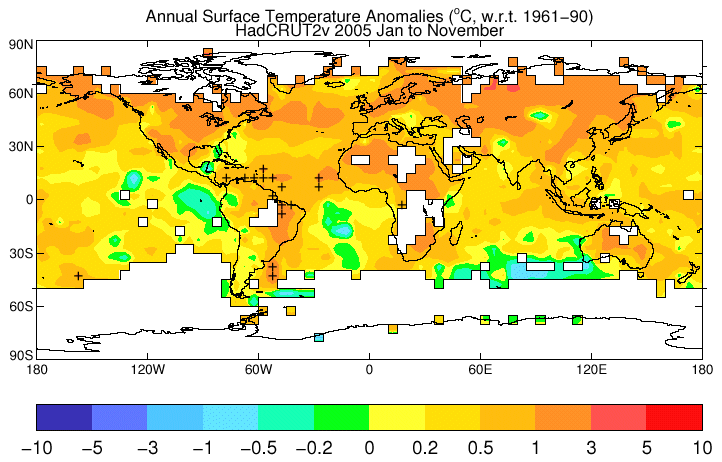
you can download a WMO pdf file claiming 2005 is
the 2nd hottest year ever. with the following global anomaly map

end for now
19 Dec 2005


