Left Arctic Right Antarctic
Coolwire 13
4 October
2005
Scroll down for critique of David
Parker's (UK Met Office) short paper in Nature in November 2004,
"Large-scale warming is not urban".
Also Campaign starts to get New Zealand out of Kyoto.
They believe global warming is melting Arctic ice so rapidly that the
region is beginning to absorb more heat from the sun, causing the ice
to melt still further and so reinforcing a vicious cycle of melting
and heating.
The greatest fear is that the Arctic has reached a "tipping point"
beyond which nothing can reverse the continual loss of sea ice and
with it the massive land glaciers of Greenland, which will raise sea
levels dramatically.
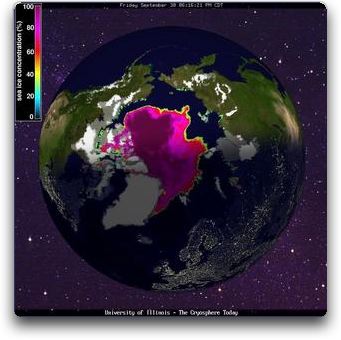
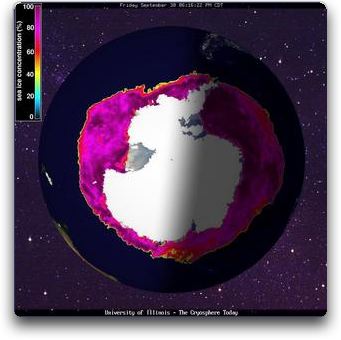
Left Arctic
Right Antarctic
SOURCE: Cryosphere Today, http://arctic.atmos.uiuc.edu/cryosphere
These
are current images, September 30, 2005, so the recent equinox means the
sun's shadow covers about half each hemisphere ... what an awesome
planet. White is land ice, purple is sea ice. Approximately minimum sea
ice extent in Arctic, maximum in Antarctic.
Next, the historical data for the Arctic sea ice area.:
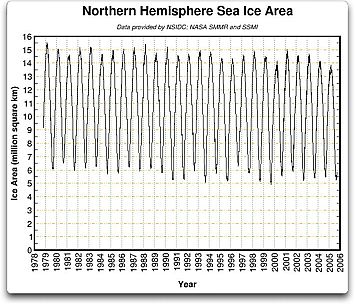
SOURCE: Cryosphere Today, http://arctic.atmos.uiuc.edu/cryosphere/IMAGES/current.area.jpg
The
scientist's fears seem to revolve around the fact that we just have had
the lowest August ice coverage on record. Note, however, that they
didn't say that it was the lowest ice coverage on record ... just the
lowest August ice coverage. They went on to say that they feared that
September would show the lowest as well, and that would make it the
lowest year on record. Yikes!
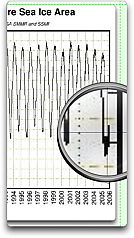
Events, however, seem to have overtaken them. On the right above I show
a close-up view of the same data, magnifying the most recent
information. We've already hit bottom on the ice extent for 2005, and
started back up. Which makes this, not the most ice-free year on
record, nor the second most, but ... 2005 is in a dismal tie for sixth
place in a small field of 27 years, out of the medals altogether.
I am becoming increasingly concerned about the number of fearful
scientists. Unfortunately, the overwhelming majority of climate science
is funded by government, and the competition for funding dollars is
intense. Focusing global media attention on the state of the cryosphere
is the way to keep funding dollars flowing to where the temperature is
cold, so I understand the pressure to spice up plain old boring science
with a little dash of fear.
But let's get real, folks. For about a decade (1979-90), minimum ice
coverage averaged around 6 million sq. km. Since 1990, minimum ice
coverage has averaged around 5.5 million sq. km. This year, last year,
the year before that, and the year before that have all been
stultifyingly normal, at around 5.5 million sq. km.
This is a "tipping point"? This is a newsworthy event?
And what is this mythical "tipping point" when it's at home? It seems
the "tipping point" relates to a postulated feedback which goes like
this:
less ice reflecting the sunlight --> more solar absorption --> warmer temperatures --> less ice etc. --> ice free Arctic
Wow,
scary stuff, climate has gone crazy, temperatures are skyrocketing,
better buy an air conditioner for the igloo, notify the polar bears ...
but wait, news-flash, this just in ...
A
sobering dose of reality. Note that from 1935-1945, arctic temperatures
were much higher than today, and dropped from that peak until
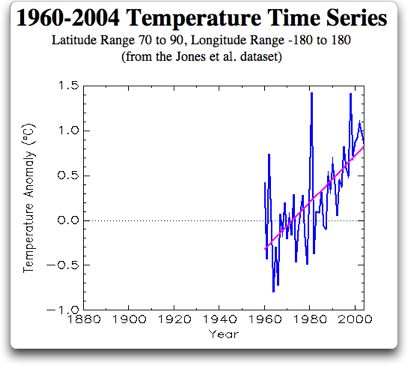
about 1960. This is why all of the scare stories on the arctic including
last year's much heralded "Arctic Climate Impact Assessment" (ACIA)
start their temperature records in 1960 -- it makes the current
situation look catastrophic. Yes, things have gotten warmer since 1960
... but what the fearful scientists somehow forget to tell you is that
temperatures were even warmer before that.
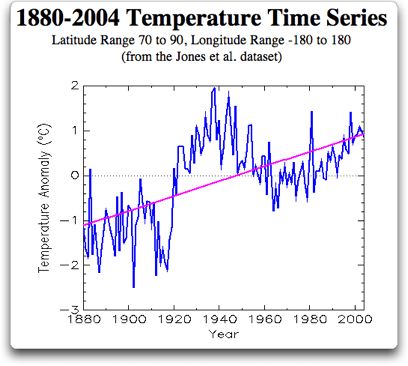
You want radical change, radical warming? From 1920 to 1940, the Arctic
temps skyrocketed, warming by +/- 4°C in two decades ... about
twice as
much as the current rise since 1960, and in less time, and all without
the benefit of CO2 increase. If Greenpeace had been around then, they'd
have had to blame it on ... heck, I don't know what they'd blame it on,
but they'd be sure it's the fault of humans.
The question is not whether the world is warming. It is whether the
warming is natural. I see nothing in the temperature graph of the
recent Arctic warming that looks unnatural. From 1880 to 1940, the
overall rise in Arctic temperature was steeper, larger, and longer
than the current (1965-2004) rise.
To recap thus far, during the period of record 1880-present, Arctic
temperatures generally:
This
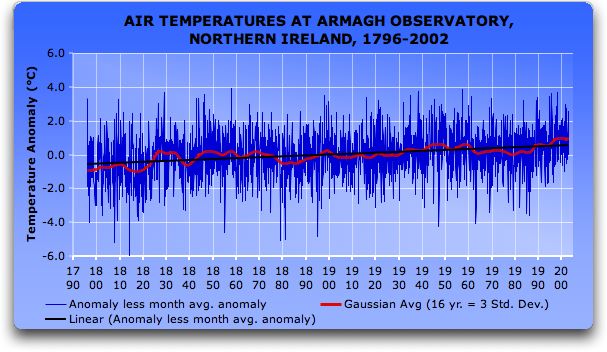
site is of interest because it has maintained one of the longest
continuous records of temperature available, and also because it is
only about twelve degrees south of the Arctic Circle.
First, look at the overall record. If anomalous, human caused,
hockey-stick shaped warming has come to the northern reaches of the
earth, somebody forgot to tell the astronomers at Armagh about it.
There is absolutely no sign of it in this two-century record. No
evidence of unnatural change, no odd variations, just a 0.6 degree per
century rise which has been sustained for two centuries.
Note the warm period (red line above linear trend) in the 1940's. This
is the same period of world-wide warmth shown in the Arctic data,
although it was more pronounced in the Arctic. Like in the Arctic, this
was followed by a cooling period (red line below linear trend). The
cooling lasted longer in Armagh, until the late 1970's. Since then, it
has warmed again, but only at the historical rate.
As I said above, the question is not whether the earth is warming. The
question is, is the warming natural or CO2 induced? If it were CO2
induced, we should see signs of increasing warming starting perhaps as
early as the 1940s, when fossil fuel use started to become significant.
We should also see signs of greatly increased warming since the end of
WWII, when fossil fuel use skyrocketed. In particular, if CO2 were
having an effect, the temperature rise per decade should be increasing
steadily since about 1945 along with the CO2.
In the Armagh records, we see neither of these predicted trends. Long
term, the temperature rise has been both steady and gradual. The
greatest trend in a single decade was from 1819-1828, a decadal
temperature rise that was much larger than any modern rise. Here is the
record of the decadal change, with each data point (blue line) showing
the temperature trend over the prior ten years:
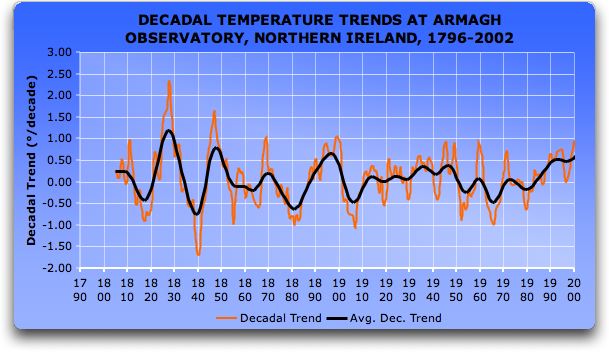
Note
that the variations in the temperature trends were generally larger in
the 1800s, with Armagh both warming and cooling at rates of up to
nearly two degrees per decade. So there is nothing unusual about the
recent temperature rise.
In summary:
Global Warming 'Past the Point of No Return'
By Steve Connor
The Independent UK
Friday 16 September 2005
A record loss of sea ice in the Arctic this summer has convinced
scientists that the northern hemisphere may have crossed a critical
threshold beyond which the climate may never recover. Scientists fear
that the Arctic has now entered an irreversible phase of warming which
will accelerate the loss of the polar sea ice that has helped to keep
the climate stable for thousands of years.
They believe global warming is melting Arctic ice so rapidly that the
region is beginning to absorb more heat from the sun, causing the ice
to melt still further and so reinforcing a vicious cycle of melting
and heating.
The greatest fear is that the Arctic has reached a "tipping point"
beyond which nothing can reverse the continual loss of sea ice and
with it the massive land glaciers of Greenland, which will raise sea
levels dramatically.
Satellites monitoring the Arctic have found that the extent of the sea
ice this August has reached its lowest monthly point on record,
dipping an unprecedented 18.2 per cent below the long-term average.
Experts believe that such a loss of Arctic sea ice in summer has not
occurred in hundreds and possibly thousands of years. It is the fourth
year in a row that the sea ice in August has fallen below the monthly
downward trend - a clear sign that melting has accelerated.
Scientists are now preparing to report a record loss of Arctic sea ice
for September, when the surface area covered by the ice traditionally
reaches its minimum extent at the end of the summer melting period.
Sea ice naturally melts in summer and reforms in winter but for the
first time on record this annual rebound did not occur last winter
when the ice of the Arctic failed to recover significantly.
Arctic specialists at the US National Snow and Ice Data Centre at
Colorado University, who have documented the gradual loss of polar sea
ice since 1978, believe that a more dramatic melt began about four
years ago.
In September 2002 the sea ice coverage of the Arctic reached its
lowest level in recorded history. Such lows have normally been
followed the next year by a rebound to more normal levels, but this
did not occur in the summers of either 2003 or 2004. This summer has
been even worse. The surface area covered by sea ice was at a record
monthly minimum for each of the summer months - June, July and now
August.
Scientists analysing the latest satellite data for September - the
traditional minimum extent for each summer - are preparing to announce
a significant shift in the stability of the Arctic sea ice, the
northern hemisphere's major "heat sink" that moderates climatic
extremes.
"The changes we've seen in the Arctic over the past few decades are
nothing short of remarkable," said Mark Serreze, one of the scientists
at the Snow and Ice Data Centre who monitor Arctic sea ice.
Scientists at the data centre are bracing themselves for the 2005
annual minimum, which is expected to be reached in mid-September, when
another record loss is forecast. A major announcement is scheduled for
20 September. "It looks like we're going to exceed it or be real close
one way or the other. It is probably going to be at least as
comparable to September 2002," Dr. Serreze said.
"This will be four Septembers in a row that we've seen a downward
trend. The feeling is we are reaching a tipping point or threshold
beyond which sea ice will not recover."
The extent of the sea ice in September is the most valuable indicator
of its health. This year's record melt means that more of the
long-term ice formed over many winters - so called multi-year ice -
has disappeared than at any time in recorded history.
Sea ice floats on the surface of the Arctic Ocean and its neighbouring
seas and normally covers an area of some 7 million square kilometres
(2.4 million square miles) during September - about the size of
Australia. However, in September 2002, this dwindled to about 2
million square miles - 16 per cent below average.
Sea ice data for August closely mirrors that for September and last
month's record low - 18.2 per cent below the monthly average -
strongly suggests that this September will see the smallest coverage
of Arctic sea ice ever recorded.
As more and more sea ice is lost during the summer, greater expanses
of open ocean are exposed to the sun which increases the rate at which
heat is absorbed in the Arctic region, Dr. Serreze said.
Sea ice reflects up to 80 per cent of sunlight hitting it but this
"albedo effect" is mostly lost when the sea is uncovered. "We've
exposed all this dark ocean to the sun's heat so that the overall heat
content increases," he explained.
Current computer models suggest that the Arctic will be entirely
ice-free during summer by the year 2070 but some scientists now
believe that even this dire prediction may be over-optimistic, said
Professor Peter Wadhams, an Arctic ice specialist at Cambridge
University.
"When the ice becomes so thin it breaks up mechanically rather than
thermodynamically. So these predictions may well be on the
over-optimistic side," he said.
As the sea ice melts, and more of the sun's energy is absorbed by the
exposed ocean, a positive feedback is created leading to the loss of
yet more ice, Professor Wadhams said.
"If anything we may be underestimating the dangers. The computer
models may not take into account collaborative positive feedback," he
said.
Sea ice keeps a cap on frigid water, keeping it cold and protecting it
from heating up. Losing the sea ice of the Arctic is likely to have
major repercussions for the climate, he said. "There could be dramatic
changes to the climate of the northern region due to the creation of a
vast expanse of open water where there was once effectively land,"
Professor Wadhams said. "You're essentially changing land into ocean
and the creation of a huge area of open ocean where there was once
land will have a very big impact on other climate parameters," he
said.
End of Forwarded Message
>>>>>>>>>>>>>>>>>>>>>>>>>>>>>>
David Parker of the UK Met Office published in Nature in November 2004 a short paper, "Large-scale warming is not urban".
In this he claimed that his analysis showing the similarity of warming trends on windy nights compared with calm nights means that urban warming is not significantly present in global temperature data.
This conclusion is becoming much quoted by those believing in the integrity of IPCC Global Warming datsets. I emailed DEP and asked him for his station list. It turned out to be the GCOS data which is vastly more rural than the Jones et al data used to compile IPCC Global Warming trends.
So I believe it is fallacious of Parker to draw his conclusion that, "This analysis demonstrates that urban warming has not introduced significant biases into estimates of recent global warming."
When he does not use the datset, ie the more urban Jones et al datset that is used by the IPCC as a measure of "Global warming".
Readers can see the Jones et al 1986 data compared to Parker's much more rural GCOS data.
Station list from Jones et al 1986 with GHCN populations (out of date) inserted by WSH, compared with the Parker 2004 vastly more rural dataset.
Stat Jones Names GHCNcode PopGHCN Parkers List 941200 DARWIN AIRPORT U 56,000 94120 Darwin 941750 THURSDAY ISLAND R 94170 Weipa 942030 BROOME R 94203 Broome 942120 HALLS CREEK R 942340 DALY WATERS R 942870 CAIRNS S 49,000 942940 TOWNSVILLE U 86,000 942990 WILLIS IS. R 943000 CARNARVON R 94300 Carnarvon 943050 ONSLOW R 943120 PORT HEDLAND S 13,000 943260 ALICE SPRINGS S 18,000 94326 AliceS 943350 CLONCURRY R 94340 Richmond 943460 LONGREACH R 943670 MACKAY S 35,000 943740 ROCKHAMPTON U 50,000 943800 GLADSTONE S 22,000 94380 Gladst 944300 MEEKATHARRA R 944760 OODNADATTA R 94480 Marree 945100 CHARLEVILLE R 945680 AMBERLEY U 100,000 94541 Inverell 945780 BRISBANE APT U 943,000 946100 PERTH U 809,000 946370 KALGOORLIE S 25,000 94637 Kalgoorlie 946460 FORREST R 946530 CEDUNA R 94653 Ceduna 946590 WOOMERA R 94693 Mildura 946720 ADELAIDE U 883,000 94784 Taree 947670 SYDNEY U 2,877,000 94805 CBorda 948210 MT. GAMBIER M.O. S 18,000 94907 ESale 948680 MELBOURNE U 2,579,000 94967 CBruny 949680 LAUNCESTON AP S 31,000 949700 HOBART, TASMANIA U 129,000 949750 HOBART,TASMANIA U 129,000 946010 CAPE LEEUWIN R 94601 CLeeuwin
A major confounding factor in Parker's analysis is I believe the colossal heat energy transported globally by winds compared to the vastly smaller heat energy in UHI's. A small example from Perth, West Australia. In our warm season, when we have high pressure to our south, we are plagued by warm night-time easterly winds howling out of the wheatblet, bringing dust and generally strong enough to blow mulch around the garden. There must be many examples globally of this sort of massive heat transfer, incl any coastal localities that enjoy onshore winds. Iin cool seasons coasts could tend to be warmed by the oceanic winds and in warm season days, cooled of course, as Perth is by the welcome Fremantle Doctor afternoon summer near gale sea breeze.
To detect the UHI in Perth T data you would have to use calm periods.
Last Updated on June 07
By W.Hughes
>>>>>>>>>>>>>>>>>>>>>>
A campaign is developing to get New Zealand out of the Kyoto accord.
This letter by Dr. Gerrit J. van der Lingen in the Christchurch Press is one of the early shots.
NZ must pull out of Kyoto accord
In her address to the Council of Trade Unions, Helen Clark said that New Zealand needed to work smarter, rather than harder, to lift productivity and compete with emerging mega-economies such as China and India (October 19). Does this mean that Helen Clark accepts the opinion of her new coalition partners that we have to scrap the carbon tax and withdraw from Kyoto? We can be as smart or hard working as we like, but with the Kyoto millstone around our necks we simply cannot succeed. Without Kyoto we can start using our abundant coal reserves for electricity generation and carbon-chemical industries, rather than export them to China to burn. According to Article 27 of the Kyoto Protocol, New Zealand can withdraw three years after the Protocol came into force. That will be in February 2008, still within the present parliamentary term. Such a withdrawal would benefit us all.
G.J. van der Lingen
Christchurch Central
>>>>>>>>>>>>>>>>>>>>.