Coolwire 11               2 February 2005

Critique of Climateprediction.net claim (as published in their January 2005 Letter to Nature) that their modelling indicates 11 degrees C global temperature rise is plausible after carbon dioxide doubling. 

I have been intrigued at the media claims of "...up to 11 degrees..." temperature increase from this http://www.climateprediction.net Oxford Uni group which utilises tens of thousands of idle PC's worldwide to run their climate model.
Apart from the fact that it is very difficult seeing exactly where they get their 11 degrees from, I can only see a max increase of ~8 degrees in Fig 1 of their Jan 05 Letter to Nature which is easily downloadable off their website. As is their 26 January 2005 Press Release.
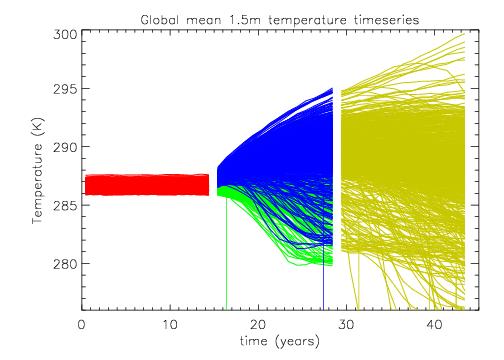
Their Fig 2 a, a histogram shows that only a tiny proportion of runs produce a result ~11 degrees.  The vast majority of models predict only a ~3.5  degree rise after the 15 year run post instant CO2 doubling.
It must be a worry for their future work out to 2100 that most of that 3.5 degree rise is in the first 5 years, then T shows little change out to the 15 years.

Let's just walk through some of their web pages.
Starting at the http://www.climateprediction.net Home Page.
Follow their Climate Science link at left, look down for link to page setting out their "Experiment strategy - the basics";  We see this Table setting out their grand strategy. As far as I can find they are yet to tell anything of Experiments 2 and 3.

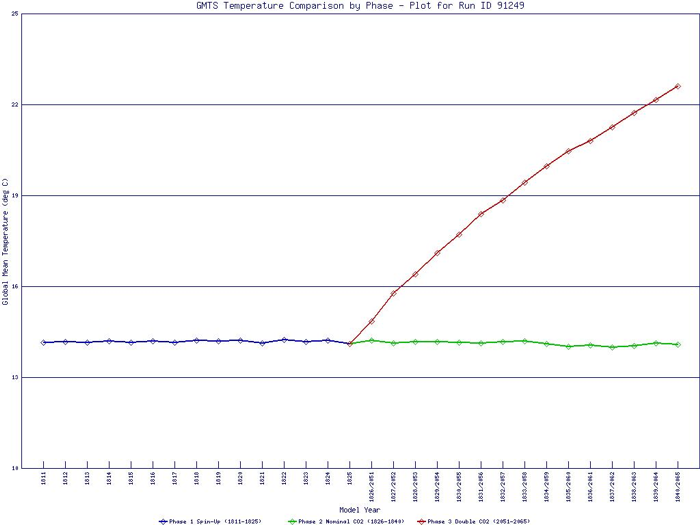
Calibration results are seen on their Graphs as 1810 to 1825, the Pre-industrial CO2 run (sometimes termed Control) is from 1825 to 1844, the Double CO2 run is from 2051 to 2065. Note that for this run CO2 is doubled instantly to 550 ppm. Why not input annual incremrents as in the real world ?? Now scroll below the table for some early results.

Strategy Table  from http://www.climateprediction.net/science/strategy.php

Explore model sensitivity to parameters

[tell me more]

Identify suitable ranges of parameters.

Each simulation includes 3 phases:

  • Calibration (15yrs)
  • Pre-industrial CO2 run (15yrs)
  • Double CO2 run (15yrs)

Simulation of 1950-2000

[tell me more]

Assess model skill by making a probability based forecast of the past climate.

Run the model with a range of initial conditions and parameters for the period 1950-2000. Compare model outputs with observations to assess how well the model performs.

Simulation of 2000-2100

[tell me more]

Make a probability based forecast of future climate.

Run the model with a range of initial conditions, forcings and parameters for the period 2000-2100.


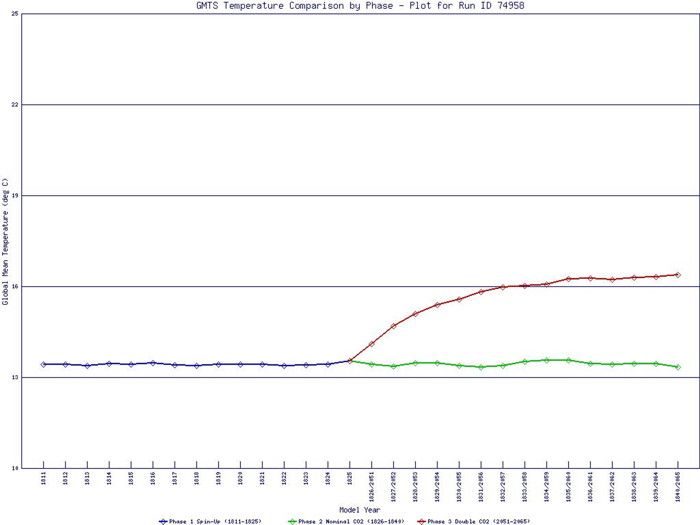
We look at some results from their first 5000 runs at http://www.climateprediction.net/science/firstresults.php


A stable,  "normal"  run. Most of the runs we are getting back at the moment look fairly similar to this 74958   Click on graph for large screen copy. The blue line is the 1810 to 1825 phase.  The green line 1825 to 1840 is the control phase.  The red line is the 2050 to 2065 doubled CO2 phase.


A warm, wet outlier. 91249 is an example of a stable experiment that went warmer and wetter than most in the doubled carbon dioxide phase.

Coolwire wants to point out here the Climateprediction.net use of  approving words such as "stable" and "normal" for the result that indicated a temperature rise of  circa 3 degrees C.  Note not 11 degrees C
Note the use of the word "outlier" for the result that indicated a temperature rise of  circa 8.5 degrees C.  Note still not 11 degrees C


At  http://climateapps2.oucs.ox.ac.uk/cpdnboinc/projstat.html  Climateprediction.net post the latest 10 runs coming into their server. You can click through these (and you will strain to find any 11 degress increases). To help readers quickly review many recent Climateprediction.net model runs Coolwire is collecting the results whenever time allows and you can see a web page full of thumbnail graphs, which if clicked on show you the full size Climateprediction.net model run result.

Now consider the Climateprediction.net Press Release of 26 January 2005 headlined "Bleak first results....."  which says, "...average temperatures could eventually rise by up to 11°C..." and makes no mention of any other temperature.  Why did not Climateprediction.net tell the press, "We are only telling you here about a minor percentage of results which between ourselves we term outliers.   We are not mentioning in this Press Release that the vast majority of our results (which we term stable and "normal") indicated a temperature rise of  3°C,  not nearly as sexy as 11°C.  
As we all know (and Climateprediction.net knows), the press are more likely to run a Global Warming  story  claiming an 11°C increase than one claiming a pifling 3°C rise.

phase 4

It is also interesting that after the Hollywood climate change disaster epic  "The day after tomorrow" came out last year, this was of sufficient  scientific interest to Climateprediction.net that they immediately threw aside their published Strategy (see above Table)which sets out the order of their Experiments. They rushed into a Phase 4 experiment which assumed the thermohaline circulation slowed in 2064, results in yellow on graph at left are from. Follow their project News links for their news archive. http://www.climateprediction.net/science/thirdresults.php
AND, note that this graph in fact shows only a tiny handful of runs plus 8°C.(you can count them ), showing how tenuous any claim is promoting an  ~11°C rise.

Finally, Coolwire notes that Climateprediction.net have published NO results replicating the 1950-2000 period.
They say at http://www.climateprediction.net/science/strategy.php

Experiment 2 (Simulation of 1950-2000)

"By using each model to produce a 'forecast' for 1950-2000, and then comparing the spread of forecasts with what actually happened, we will get an idea of how good our range of models is - do most of them do a good job of replicating what actually happened? This will also let us 'rank' models according to how well they do."
[Note: To be launched in 2005.]  Coolwire says, "sounds fine, lets see some results."


Under Experiment 3 (Simulation of 2000-2100) they say, "When this experiment finishes, we will have a range of forecasts for 21st century climate. The final stage is to 'weight' the forecast of each model according to its ranking in experiment 2 - so, for example, if a model that did really well in experiment 2 predicts a warming of 2 degrees, and one that did badly in experiment 2 predicts a warming of 10 degrees, we will believe the first one more than the second."
Once again Coolwire has to say, "this sounds fine but the propositions are at odds with the tenor of their Letter to Nature and their sensationalist 26 Jan '05 Press release.

All in all,  Coolwire thinks that illustrious Oxford scholars would be turning in their graves.

Back to http://www.warwickhughes.com/climate/

Back to http://www.warwickhughes.com/