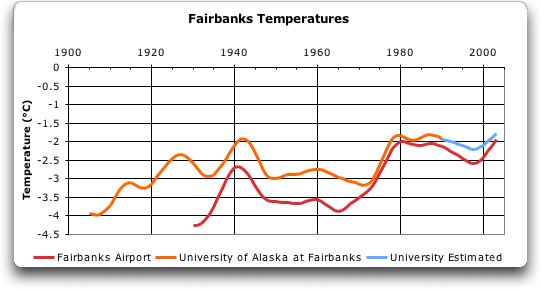
The excessive rise in the Fairbanks record has long been recognized as
being a result of the Urban Heat Island (UHI) effect (see for example Magee,
N., Curtis J., Wendler, G. "The Urban Heat Island Effect at Fairbanks,
Alaska", Theoretical & Applied Climatology, Vol. 64, pages 39-47). Because
of this distortion of the Fairbanks record, I have used the University record.
The University record (orange) stops at 1990. Based on the close correspondence
between the two records, in order to get a long record for the area I have
taken the liberty of extending the last few years of the University record
(extension shown in blue) by linear regression from the Airport record.
Here are two sets of independent data for Fairbanks, one from the Alaska
Climate Center at the University of Alaska at Fairbanks, and the other from
the NASA Goddard Institute of Space Scientists:
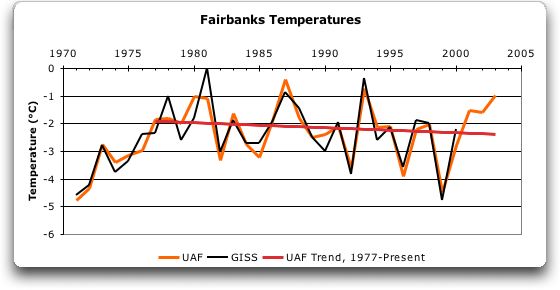
Note the agreement between the two independent data
sets, both of which show that Fairbanks has been cooling since 1977.
Also note that there have been four years since 1970 which were as warm or
warmer than 2003 (1980, 1981, 1987, and 1994). In short, for nearly a quarter
of a century, the temperature in Fairbanks has been dropping.
It has also been claimed that the ice cover of the Northern Hemisphere
has dropped radically. Again, perception is outstripping reality in this
area. Some areas have less ice, in particular the North coast of Alaska,
but other areas have more ice. Net change? Here's the record of the last
year, current to mid-August 2004:
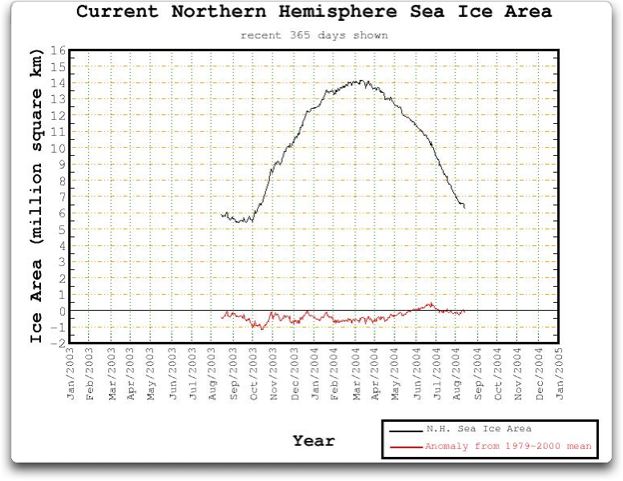
SOURCE: University of Illinois Arctic Climate Group
http://arctic.atmos.uiuc.edu/cryosphere/
Note that the Northern Hemisphere sea ice currently (mid August) covers
exactly the same area that it covered on average for the 22 years from
1979-2000.
To determine the short-term trend for the entire state of Alaska, I plotted the Gaussian average of the data shown in the chart you get when you click the “Mean of all Stations: +2.69” text at the bottom of the top graphic on the page cited under the chart below. I also show the linear trend since the last PDO shift. There has been a slight decrease in temperature (-0.5 degrees/decade) since 1980.
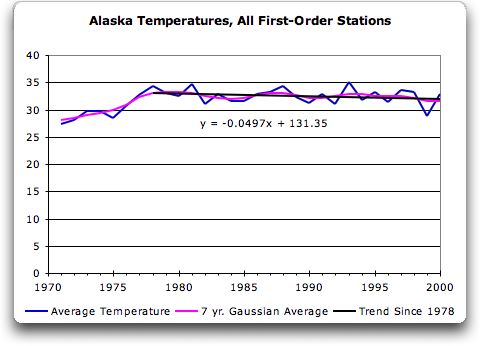
SOURCE: Alaska Climate Research Center, University of Alaska at Fairbanks
http://climate.gi.alaska.edu/ClimTrends/30year/30yr.html
Like the Fairbanks temperature, the temperature of the entire state has
been dropping since about 1978.
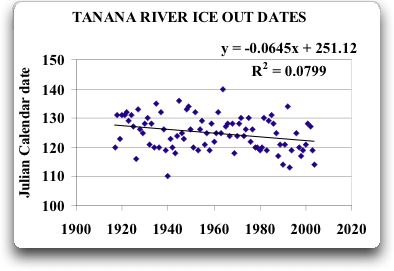
Other people have said that the date of the ice break up on the Nenana
river shows that Alaska is warming drastically. Here's a typical analysis
of the Nenana data claiming to show a weak trend whereby the warming is causing
the ice to break up earlier:
SOURCE: Dominique Bachelet, personal communication
NENANA DATA AVAILABLE FROM: ftp://sidads.colorado.edu/pub/DATASETS/NENANA/nenana.dat
Again, this only shows the inadequacy of using trend lines with climate
data. Climate is a chaotic system, subject to unpredictable changes. For climate
data, trend lines are useless. Gaussian or other similar averaging is the
only thing that will allow us to understand the data. In addition, it is
necessary to have long term records to have any chance of understanding what
is happening.
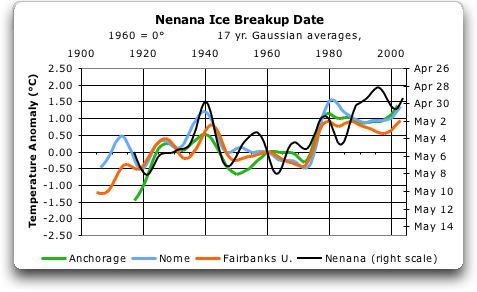
For example, here is the Gaussian average of several long term sets of
Alaskan climate data, including the Nenana ice break up:
TEMPERATURE DATA SOURCE: NASA Goddard Institute
of Space Sciences
http://www.giss.nasa.gov/data/update/gistemp/station_data/
We can see that the Nenana ice breakup is ruled by the same factor which
rules all of Alaska's weather -- the Pacific Decadal Oscillation. All of
these records have the same form -- rising to a high around 1940, dropping
to 1950, level to 1970, rising to 1978, and basically level since then.
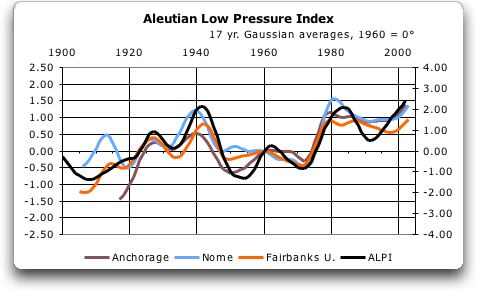
How do we know that Alaska is ruled by the PDO? The strength of the PDO
can be measured by the Aleutian Low Pressure Index, the size of the low pressure
area around the Aleutians. Here's some Alaskan temperatures plotted against
the PDO:
TEMPERATURE DATA SOURCE: NASA Goddard Institute
of Space Sciences
http://www.giss.nasa.gov/data/update/gistemp/station_data/
ALPI DATA SOURCE: Beamish, R.J., C.E. Neville and A.J. Cass. 1997. Production
of Fraser River sockeye salmon (Oncorhynchus nerka) in relation to decadal-scale
changes in the climate and the ocean. Can. J. Fish. Aquat. Sci. 54: 543-554.
http://www.pac.dfo-mpo.gc.ca/sci/sa-mfpd/downloads/alpi.txt
We can see that the temperatures of cities as far apart and as climatically
different as Fairbanks, Nome, and Anchorage slavishly follow the Pacific
Daily Oscillation. As the PDO goes, so goes Alaska. Because of this, we can
control the temperature data for the PDO, to see if there are any changes
which are not attributable to the PDO. Here is the result of that
analysis for the same cities:
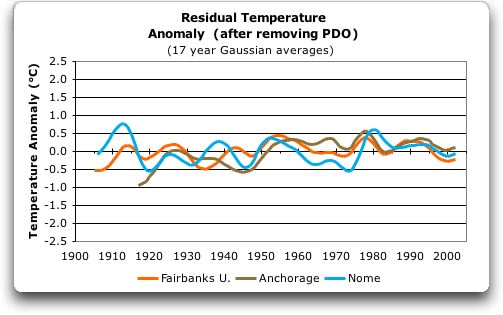
Several things are of interest about this record.
One is that there has been very little change in detrended temperatures over
the period of the record. Only Anchorage has warmed significantly, about a
degree since the start of the record.
Nor is there any indication of "greenhouse warming" -- Alaskan temperatures
have not been increasing as the CO2 increased; in fact they have been decreasing
since 1980. This lack of warming in the post-1980 record is shown in both
the raw temperature record as well as the record corrected for effect of the
PDO.
Finally, the actual temperature rise for Anchorage is sure to be less than
shown, because this data is not corrected for the Urban Heat Island (UHI)
effect. The increased size of the Urban Heat Island effect in the Arctic
regions is not widely appreciated. Because the UHI is dependent in part on
the the difference in temperature between the heat sources and the air, the
UHI is enhanced in cold regions. See, for example, "THE URBAN HEAT ISLAND
IN WINTER AT BARROW, ALASKA", Kenneth Hinkel, Frederick Nelson, Anna Klene
and Julianne Bell, available at http://www.geography.uc.edu/~kenhinke/uhi/BUHIS-IJOC.pdf.
They show that a full two degree UHI occurs in wintertime in Barrow,
a town of only 2600 people, and that the effect can be measured for miles
outside of the town itself. Thus the real temperature rise in these cities
must be less than is shown above.
As an estimate of the amount of the Anchorage UHI, here is the Anchorage
temperature compared to the nearest rural station, Matanuska (60 km distant):
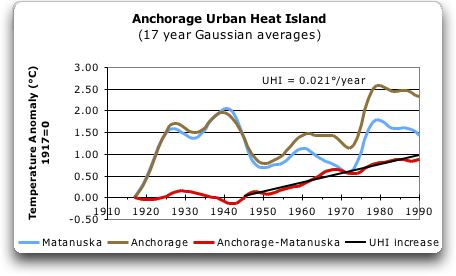
Anchorage's urban development took off after World
War II. This is clearly reflected in the graph, which shows Anchorage steadily
warming with respect to Matanuska since that time. In 1990, the UHI for Anchorage
was about one full degree, with an increase of about +0.021 degrees per year
since 1945. Knowing this, we can adjust the Anchorage temperature by that
amount and re-run our residual analysis. Here, then, is the final temperature
record for the three cities, detrended for the PDO and with the Anchorage
UHI removed:
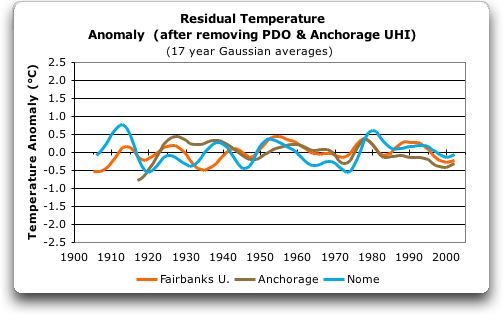
No warming overall, and cooling since 1978, with
all three stations showing a swing of only +/- 0.5 degrees ... pretty tame
stuff, no headlines here.
Having investigated the past, and having seen that the state is not currently overheating, what can a computer General Circulation Model (GCM) tell us about the future? Well ... not much. Here are runs from a couple of computer GCMs, one from the Canadian Climate Center (CGCM1) and one from the UK Met Office Hadley Center (HADCM2SUL), trying to reproduce just five years of Alaskan temperatures:
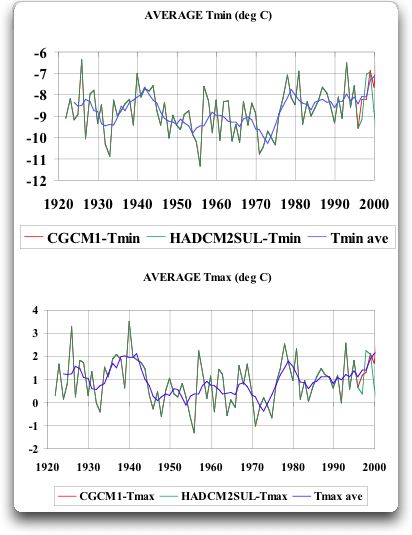
SOURCE: Dominique Bachelet, personal communication
There are four colors of lines in these graphs -- dark blue (averaged
data), light blue (HADCM2SUL), green-gray (unlisted), and red (CGCM1). However,
only three of them are listed. I assume the fourth is the raw Tmax or Tmin
data.
The GCM results do not inspire confidence ... the two computer runs started
in 1995, and by the year 2000, the two projections are two full degrees apart.
In other words, at least one (and possibly both) of these GCMs has
an error of two degrees in five years (forty degrees per century?). This does
not exactly make me want to believe them ... if these are the best tools available,
then I'll take no tool at all over these.
If these GCM models actually worked, we would be able to give them the
conditions (CO2, temperature, etc.) for 1920, and they would be able to predict
the current temperature, as well as the global climate shift of 1976/77,
the global decline in temperature from 1940 to 1970, and the other climate
features of the years from 1920 to the present. To my knowledge, however,
there is not one GCM which can come anywhere near to doing that. None.
And even if a GCM could do that, unfortunately this would still
not mean that it could correctly predict the future climate. That's the problem
with chaotic systems -- unlike deterministic systems, they don't repeat
the past. Another example of a chaotic system is the stock market. This
is an arena where, as the US government forces the brokers to state in their
advertisements, "Prior performance is no guarantee of future success." In
other words, just because a GCM might be able to predict the past (and to
date no GCM can even do that), it's certainly no guarantee that it can predict
the future.
(As an aside, I note that the historical data used by the GCMs, like my
data above, shows that the temperature of Alaska has dropped since
1980 ...)
The problem with GCMs is that we are trying to predict a chaotic phenomena. The PDO is a very good example of this difficulty, as it even more complex -- it is a bi-stable chaotic phenomenon. It flips from a warm state to a cool state at unpredictable intervals. Simply put, we don't have a clue what flips it from one state to another, and the length of the cycle is so great that we have very little data upon which to even hazard a guess.