Canada, Yellowknife Region
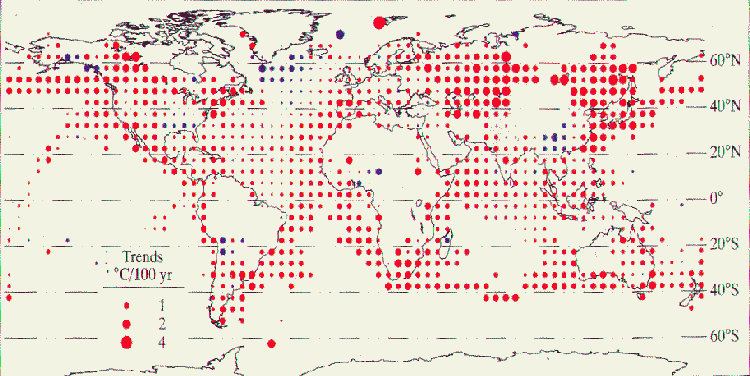
This weeks review is completely different from the usual comparison of a UHI affected city station with surrounding rural stations. The Yellowknife region is said to be the fastest warming area of Canada as measured by the CRU Jones 1994, data. The Karl 1998 paper in the IPCC book, "Regional Impacts of Climate Change", carries a map produced here as Figure 1, which shows warming anomalies from the Jones 1994 CRU dataset for five degree global grid boxes. The two large red dots can be seen over NW Canada mark the centres of five degree grid boxes warming at ~ 2 degrees over the 1901-1996 period.
This review compares data from three international climatology research groups and shows that, data from two actualy reveal cooling over the Yellowknife region, while only CRU and the Jones 1994 data claims to show this high degree of warming.
Figure 1 Global Grid Point Warming Anomalies
using CRU Jones 1994 data, published in Karl 1998.

The data behind this high rate of warming is examined in
this review along with whatever other temperature datasets are
available.
Only three stations with any useful length of
recordings are avalable and these are are shown in Figure 2.
Figure 2 Station Positions Yellowknife Region.
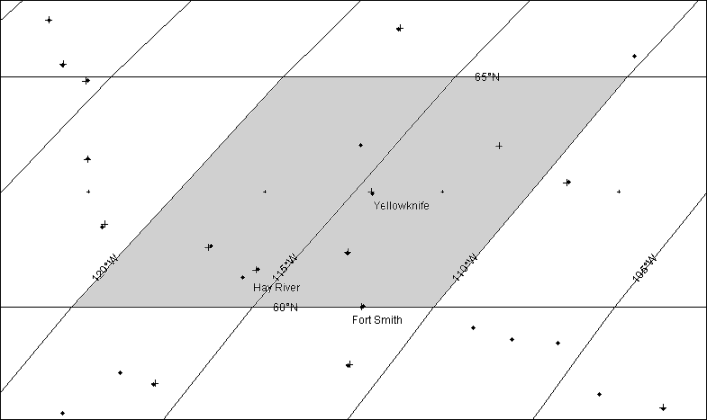
Crosses on the map mark CRU stations and diamonds mark the
GHCN series, many stations are in both datasets of course.
Note that The Hay River site is directly above the H in Hay.
For each labelled station three sets of data have been reviewed,
these are;
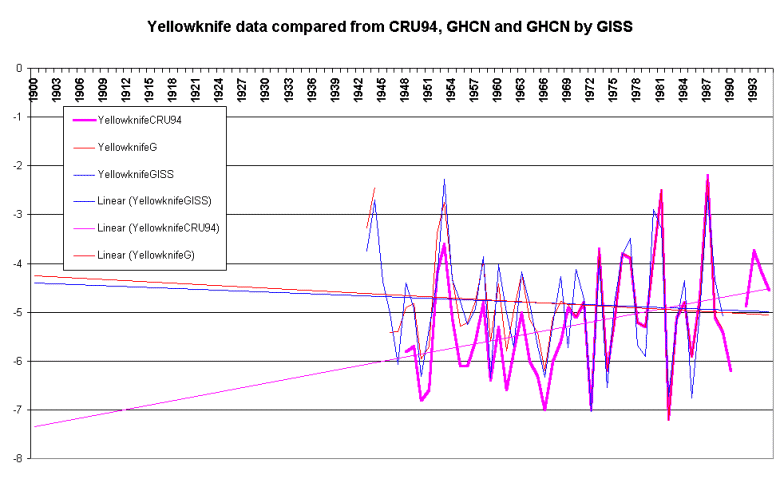
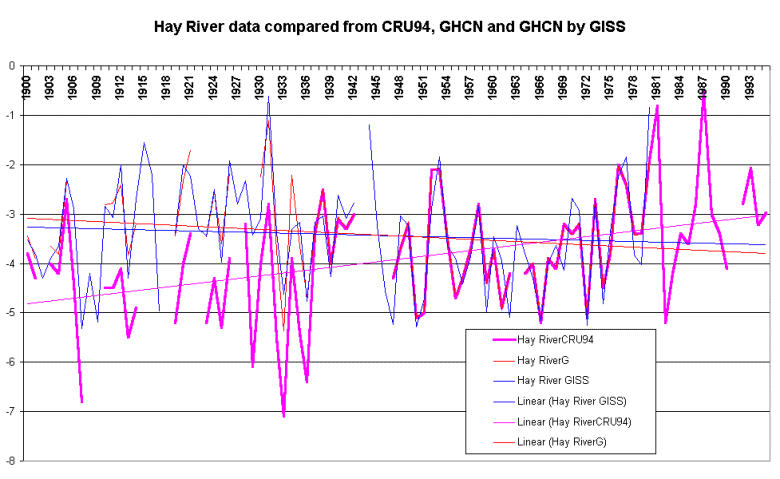
Figures 3, 4 & 5 below compare all three sets of data for
each site and Table A sets out the contrasting
temperature trends estimated from MS generated linear
trendlines shown on the graphs. It is noteworthy that
for all three stations the CRU trends register significantly more
warming than the other two data sources.
Table A
| Stations | CRU Jones 1994 | Version 2 GHCN adjusted | GISS GHCN adjusted |
| Fort Smith | ~ +2.7 degrees, 77 years | ~ +1.75 degrees, 58 years | ~ +0.85 degrees, 55 years |
| Yellowknife | ~ +1.5 degrees, 50 years | ~ -0.75 degrees, 50 years | ~ -0.6 degrees, 50 years |
| Hay River | ~ +1.8 degrees, 95 years | ~ -0.8 degrees, 90 years | ~ -0.4 degrees, 90 years |
The Fort Smith data has been adjusted by GHCN and GISS from 1948 to 1970 which reduces the warming and also only CRU use the years prior to 1930. Presumably the GHCN compilers considered those data suspect.
Figure 3
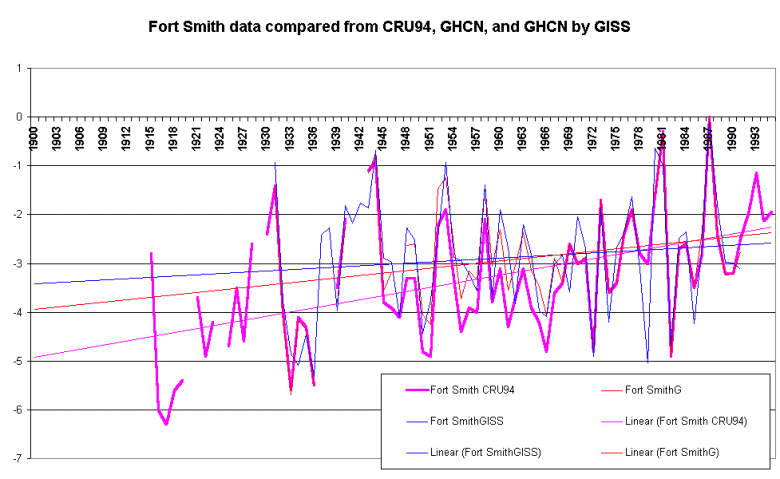
Figure 4
Yellowknife has no data prior to the 1940's and once again GHCN and GISS have made adjustments prior to 1970 and use early 1940's readings which leave their data with slight cooling trends over the 50 years.
The Hay River graph shows GHCN and GISS found more
complete data pre 1940 and also favour a warm adjustment in those
years. Both GHCN and GISS data cools slightly over the last
century
Figure 5
Summary
There are many missing years in all three stations,
which reduces confidence in data.
It is interesting that in one of the higher warming areas for CRU
grid boxes two other notable climate research teams disagree with
the CRU trends. All the above leaves this
high amplitude warming on a shaky foundation when two out of
three international research teams actually find for a slight
cooling over the century.
Because high latitude records tend to be riddled with data gaps and researchers would have to suspect other homogeneity problems, the obvious way to resolving issues raised in this review would be to review trends further south in Canada, where there are more stations with better data quality. Findings could then be extended further north from sounder foundations.
You read it first here
Back to Main Page
Posted 16, July, 2000
© 2000 Warwick Hughes,
www.globalwarming-news.com