South West Japan
The cities of Fukuoka, with a population of over a million, and Nagasaki (around 500,000) are the major centers on the southern Japanese island of Kyushu. They provide interesting examples of faulty CRU methodology and of non-climatic warming in the aggregates which the IPCC uses to prove “ global warming”.
Key flaws in the CRU’s approach to these cities are:
* selection of urban records with obvious artificial urban
warming,
* application of an incorrect correction,
* failing to note other neighbouring correctable discontinuities,
* selection of inapropriate stations for comparison,
* failing to properly consider rural data.
This example also demonstrates how the whole IPCC project of
station record aggregation is bedevilled by faulty data.
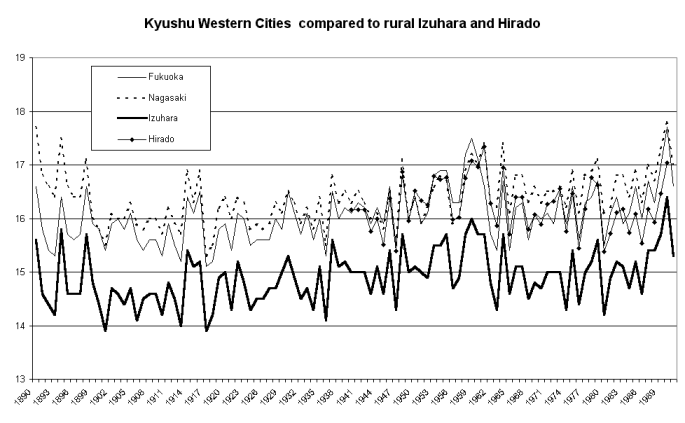
Graph 1 shows Fukuoka, Nagasaki, and two stations classified in the GHCN as rural: Izuhara, on Tsushima Island in the Korea Strait; and Hirado, on the SW tip of Kyushu, which was not included in the CRU dataset. The graph shows Fukuoka, Nagasaki and Izuhara all warming after 1960 relative to Hirado.
The warming of big cities like Fukuoka and Nagasaki is hardly surprising, given the economic expansion of Japan over the last four decades. But does the similar trend in Izuhara suggest the underlying climate of the region is also warming, or is the flat trend in Hirado closer to the truth?
CRU used Izuhara uncorrected, after comparing it to Mokopo, a city of 200,000 near the southern tip of South Korea, and Shimonoseki, a city of over 260,000 just north of Fukuoka. It is interesting that, while Shimonoseki was not judged fit for inclusion in CRU’s final dataset, it was apparently considered good enough to help validate Izuhara. The critical fault here was that CRU did not compare Izuhara with other rural stations.
Before we look more closely as Izuhara, let us also note the non-climatic inhomogeneities in the graph between 1960 and 1961. CRU made a “correction for a discontinuity” in Fukuoka of plus 0.8 degrees for the years 1890-1960. CRU's notes show this was based only on comparison with Izuhara, ignoring the closer Nagasaki.
The “correction” neatly disguises Fukuoka’s steady warming up to 1960 relative to Nagasaki. And it is clearly too large, as it leaves Fukuoka plotting just warmer than Nagasaki immediately before 1960, but significantly cooler thereafter.
Graph 1

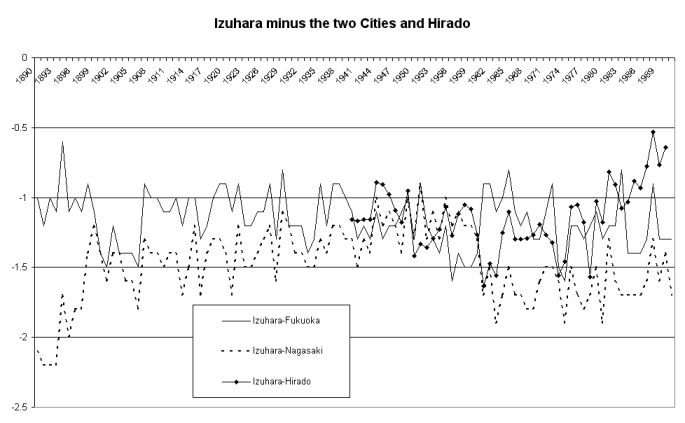
CRU also failed to notice that Izuhara itself shows a non-climatic step at 1960. You can see this in Graph 2. The lines for Izuhara minus Nagasaki and Izuhara minus Hirado take precipitate steps down at that time. There are any number of possible explanations: Nagasaki and Hirado might have had non-climatic warming jumps in 1960 due to site or equipment changes, or perhaps all the stations had such changes.
The fact that the line showing Izuhara minus Fukuoka sharply crosses the other two lines at 1960-61 reinforces the point that the correction made to Fukuoka was excessive. The disparate non-climatic trends that result lead us back to the key problem of whether Izuhara or Hirado is the more valid measure of regional climate.
Graph 2
Fortunately Hirado is not the only other rural station in the
region. On the coast of South Korea, SW of Pusan, there are
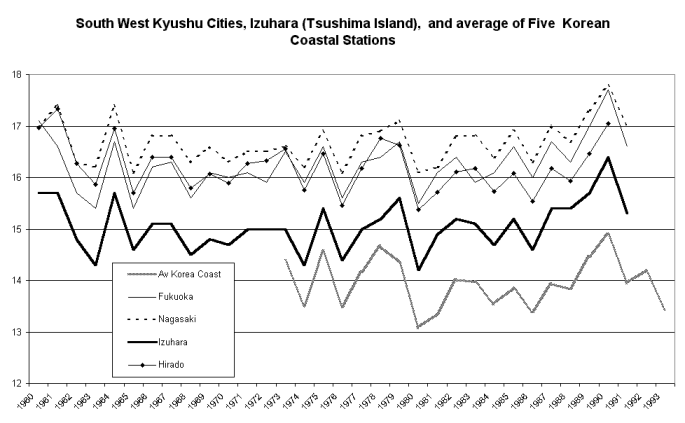
five rural stations with records from 1973. Graph 3
compares the average of their data with the four Japanese
stations we have looked at. The graph starts at 1960 to get
over the vexed non-climatic changes before then.
The first thing to notice is that all the data in graph 3 are more homogenous that in previous graphs. This could be due to better quality maintainance of equipment, sites and records following hightened awareness of climate issues. It is crystal clear that the five Korean rurals have a very similar trend to Hirado. This casts doubt on the warming in Izuhara which is the "odd man out" of the seven rurals.
Graph 3
Why then is Izuhara warming? Irrespective of population
growth, a rural station can show non-climatic warming if there is
a drift in equipment or site conditions. For example,
deterioration in the white paint on the Stevenson screen can
cause warming, or a hedge could grow and block cooling breezes,
or progressive increases in nearby paving or addition of
buildings could all result in a warm drift. Conversely,
removal of paving and buildings and replacing them by grass could
cause a cooling drift. Common sense tells us that the more
usual trend is to more paving and buildings in the vicinity of
communities, which is where temperature recording stations are
generally located.
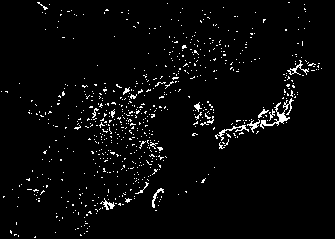 Izuhara is the main administrative center of
the Tsushima islands, which have a population of almost
100,000. You can pick them out as a bright little dot in
the narrowest gap between Japan and the Korean peninsula on this
image of NASA earthlights. This earthlights image is a
graphic reminder of the direction IPCC policies will take our
economies. Just look at the Peoples Paradise of North Korea,
scarcely a light.
Japanese readers may be able to tell me just how Izuhara has
developed over recent decades. It is almost certainly no
longer “ rural” as shown in the GHCN database –
but that would not be surprising, as my other pages have already
shown that GHCN population data is typically 25 years out of
date.
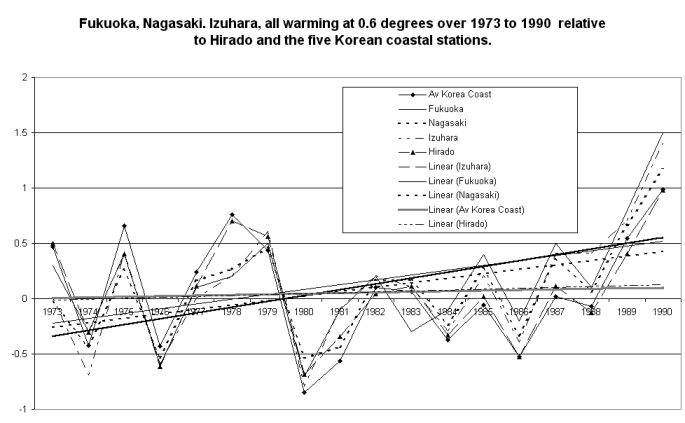
The final graph shows the the same stations as in Graph 3 but in sharper focus, by normalising each station to its 1975-85 average and considering only 1973-90, where all stations are available. Note how the rurals (the diamond and triangle lines) start at the top of the skein, but finish near the bottom. The two cities and Izuhara have caught them up and overtaken them with a relative warming of 0.6 degrees in just 18 years.
Graph 4
The IPCC claims a“ global warming” of 0.6 degrees over
the whole of the twentieth century, based on CRU data. This
study shows how easy it is to discover warming five times as fast
– as long as you are prepared to stick with city data and
ignore the fact that rural stations tell a completely different
story.
© Warwick Hughes, 2000 - 2001
globalwarming-news.com
You saw it first here.
Posted 23, June, 2000, re written 23, June, 2001
Back to Cities List
Back to Front Page