Industrial Carbon Emissions and Global Carbon
Carbon Sinks
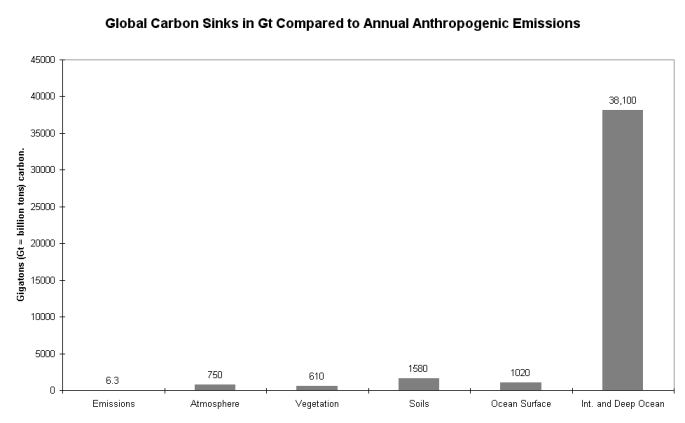
This graphic demonstrates the relative size of global carbon sinks or stores. Interaction and transfers between these various sinks are what constitutes the carbon cycle.
As can be seen annual industrial emissions are very small
compared to the size of many of the sinks. One
implication of this for greenhouse science is that many factors
can affect the quantity of carbon dioxide in the atmosphere from
month to month and year to year. For example, at times of
cool sea surface temperatures (SST), the sea tends to absorb more
carbon dioxide. Conversely, when SST's are
warm, the oceans can actually give off carbon dioxide, thus
putting a spike into the graphs of atmospheric carbon
dioxide. This is noticeable around El Nino events and will
be shown in subsequent pages and graphs. Seasonal changes in the
uptake and release of atmospheric carbon dioxide by the large
northern hemisphere forests produces distinct seasonal
fluctuations in atmospheric carbon dioxide.
The importance of forests as sinks is being increased by the
carbon dioxide fertilization effect which is increasing the mass
of forests as vegation growth rates increase due to the slowly
increasing carbon dioxide in our atmosphere. As the years
pass this poorly understood effect will have an increasing
influence on atmospheric carbon dioxide outcomes.
Australian Landmass Absorbs it's Own Emissions:
It has been known for most of the last decade that Australia for
example, absorbs more carbon dioxide in vegetation and soils than
it emits. This area of science has got caught up in the
politically charged Kyoto process of setting emission reduction
targets as many countries have been planning to use increasing
forest areas as a way of offsetting economically painfull
emission reductions from mandatory cutbacks to energy
use. Recently on national TV viewers would have seen
Green spokesmen berating the Government for trying to offset
costly emission reductions with re-afforestation driven increases
in carbon sinks. There are moves in the
IPCC to back up this green stand which is rather surreal
considering the multiple good effects of forests; for increasing
wildlife habitat, ameliorating land use problems such
as salination, reducing soil erosion and loss, improving stream
and river quality, thus good effect on water supplies in
dams (sorry, I forgot, dams are bad ), improving
microclimate and increasing recreation opportunities for the
frazzled taxpayers paying for this whole IPCC boondoggle.
You can also bet your last dollar that as we read and write these
words, pro-warming scientists will be producing new research
minimizing the good effects and growth prospects for forest
sinks. Papers will progress rapidly through the peer review
process, jounal editors will see that these masterpices are at
the printers in a fraction of normal time. Through
the history of the IPCC there has been no shortage of
pro-warming scientific effort for example;
Many issues such as these will be exposed and discussed in later pages.
Global Industrial Carbon Emissions
The graph below shows annual growth in carbon emissions from
all industrial sources with the annual rate of increase
superimposed. The IPCC Business as Usual scenario numbers
show the usual unrealistic forward estimates that have
blighted information given to policymakers from the
inception of the greenhouse issue over a decade ago.
The rate of increase percentage figures shows clearly a steady
falling off in the rate of increase over the last twenty or so
years, a rather obvious fact fact that does not seem to have
penetrated through to the IPCC carbon meisters.
Shown for the first time here.
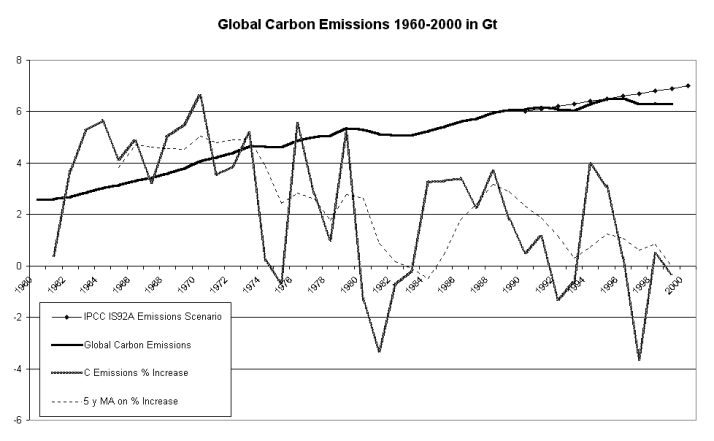
Emission numbers from CDIAC, US DOE, note that the figures for
recent years may be slightly revised as updates come out.
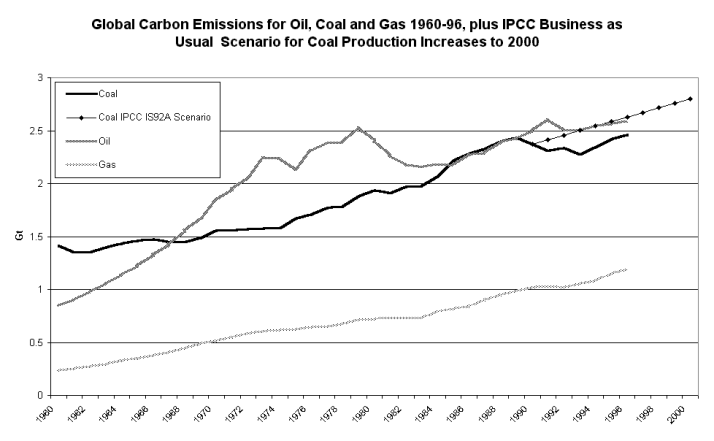
Global Carbon Emissions, Coal, Oil and Gas.
The graph below shows the breakdown of annual tonnages
of carbon emissions for the main categories of fuels. The
significant flattening in the trend for oil after the years
of the oil shocks, mid 1970's to early 80's, is a major factor
preventing emission levels reaching those predicted by IPCC
scenarios.
Note also that although increased coal production during the
1980's compensated for falling oil production early that
decade, the 90's was a period of slower growth in
emissions frrom coal, note the graph below is only to 1996 while
the graph above shows global numbers to 1999. Judging by
the years 1997, 98, 99 above, the trends for coal and oil
below are likely to flatten off again before 1999.
Gas production is rising more steadily in part due to the greater
energy output from gas per unit of carbon emitted causing it to
be a more favoured energy source in these times of pressure on
carbon emissions.
Discussion
What do these global carbon emission numbers portend for the
next few decades ahead ?
Will the global economy suddenly go on steroids and start pumping
out carbon to justify the IPCC scenarios used to influence
policymakers ?
Is the tooth fairy going to bring you money ?
Or is the falling off in the rate of increase in carbon emissions
a real fact of economic life for the planet driven by
factors such as;
All of the above factors are having an effect to moderate growth in carbon emissions now and will continue to affect patterns of energy use / carbon emissions in decades ahead. Other factors that could add to this reducing reliance on carbon would include developments in nuclear and fusion energy sources that increase the political acceptablity of these potentially very large non-carbon emitting energy resources.
As all the above trends influence our energy use in decades ahead and if we are clever enough to disregard the Greens and get the full benefit from increasing forest areas it is possible that atmospheric carbon dioxide content may never rise to the landmark doubling of say 700 ppm. There are enormous implications for IPCC models / scenorios which predict levels way beyond this.
You read it first here.
© Warwick Hughes, 2000
www.globalwarming-news.com
Back to Front Page
Page updated 8, June, 2000