Our GreenLeft ALP/ABC has an interesting article on Australian rainfall during our often wet 2022.
Raining champs – Records fell up and down Australia’s east coast as rains, floods and insurance payouts all hit new peaks. As we welcome back the sun to our lives in 2023, what should we do to prepare for the next big wet? – Casey Briggs 31Dec22 – www.abc.net.au/news/2022-12-31/australian-weather-rain-2022-records-broken-flooding/101789262
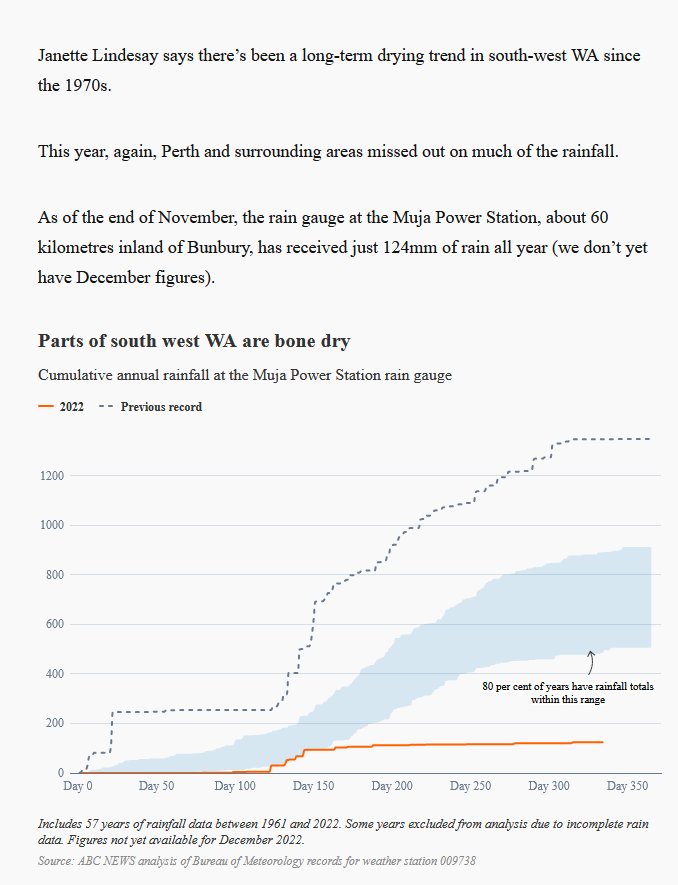
There are plenty of interesting graphics and photos to help us reprise 2022. Here and there through the article there are quotes from Professor Janette Lindesay, a climatologist at the Australian National University. About 2/3rds down their page we come to a map in shades of greens a greys preceded by text saying – “This map shows you how much wetter 2022 has been. We’ve taken data from nearly 1,000 weather stations, to map out how different this year’s rain is from the median of the past 30 years.” You see parts of SW WA are in a grey zone which means [10% dryer than …the median of the past 30 years”. Reading down under our grey and green map we see a quote by Professor Janette Lindesay “Janette Lindesay says there’s been a long-term drying trend in south-west WA since the 1970s.” Moving down the ABC says “This year, again, Perth and surrounding areas missed out on much of the rainfall.” Yet Perth Metro recorded 700.2mm in 2022 which is only 36.6mm under the annual mean. The ABC goes on “As of the end of November, the rain gauge at the Muja Power Station, about 60 kilometres inland of Bunbury, has received just 124mm of rain all year (we don’t yet have December figures).” Beneath that are two charts headed by “Parts of south west WA are bone dry – Cumulative annual rainfall at the Muja Power Station rain gauge” This graphic
www.warwickhughes.com/agri16/ABC-Muja-rain31Dec22.jpg
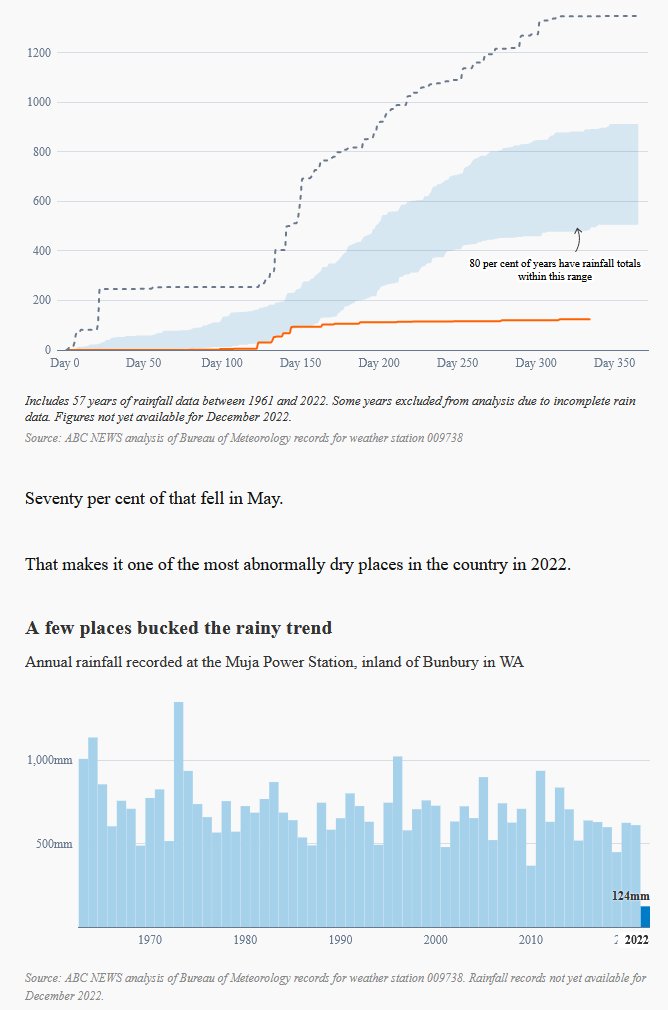
and the chart underneath shows how BoM rainfall data from Muja Power Station BoM #9738 has only recorded 124mm rain for 2022. www.warwickhughes.com/agri16/ABC-Muja-rainb31Dec22.jpg
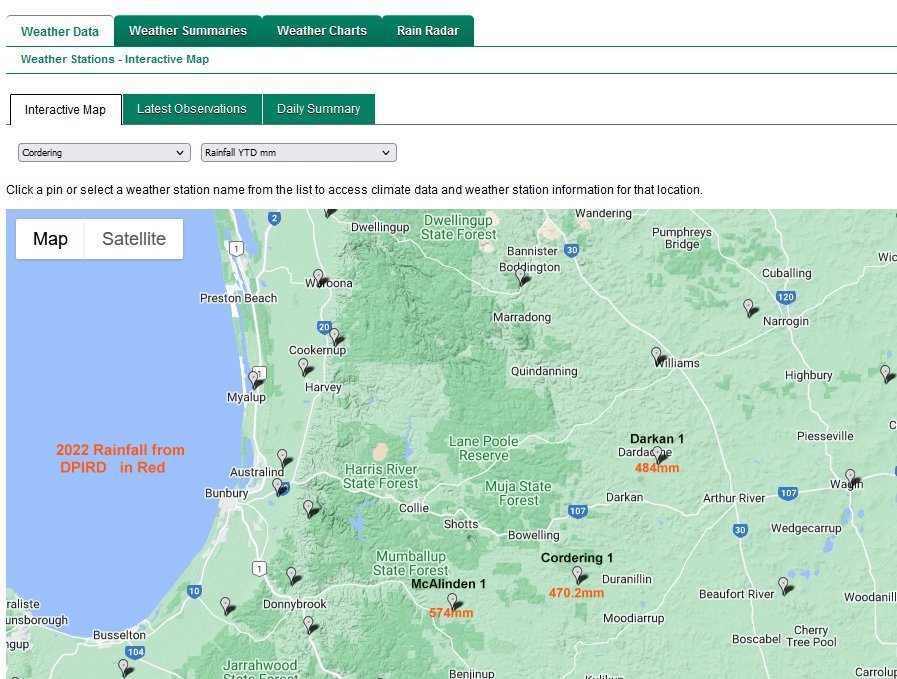
I have checked rainfall from surrounding BoM and WA DPIRD gauges and those data offer no support for the notion that Muja Power Station BoM #9738 can be relied upon. Here are links to two Collie/Muja district maps annotated with 2022 rainfall, one from BoM -https://www.warwickhughes.com/agri16/BoM-Muja-district-rain2022.jpg
and the other from WA DPIRD.- www.warwickhughes.com/agri16/DPIRD-map.jpg
Remember the WA DPIRD has a separate network of weather stations indie of BoM.
You can make various 2022 rain maps now at this BoM page –
www.bom.gov.au/climate/maps/rainfall/?variable=rainfall&map=totals&period=12month®ion=wa&year=2022&month=12&day=31
Below here hoping to show screen save of Muja Siteinfo pdf page 9 re rain gauge failing performance tests in 2011 – see comments below

Bustard Head Lighthouse weather station an example of nobody cared enough
The ABC have a story – Bustard Head Lighthouse near Agnes Water a relaxing place for volunteers to house-sit 31Dec22
www.abc.net.au/news/2022-12-31/agnes-water-lighthouse-volunteer-caretakers/101801360
When I check on BoM Climate Data Online (CDO) rainfall data for Bustard Head Lighthouse #39018 starts at 1885 and looks mostly complete to 1985 (when it was automated) then a big gap to 2003 then it is riddled with gaps to the present as is much weather data from the wide brown land. www.bom.gov.au/climate/data/?ref=ftr
Temperature shows in two blocks – 1913 to 1938 then 1953 to 1986. So we can record rainfall in recent decades but temperature is beyond the capacity of Australia, yet the photo in the ABC article shows a Stevenson screen.
In 2014 there was another media story – Lighthouse of horror: The disturbing history of Queensland’s Bustard Head lightstation Sam Clench 23May2014 www.news.com.au/travel/lighthouse-of-horror-the-disturbing-history-of-queenslands-bustard-head-lightstation/news-story/e44d619f78bcfa4dd275dafb04870968
I also blogged on the subject in 2015 – Was the automating of Australian lighthouses in the 1990’s a policy stupidity ?
www.warwickhughes.com/blog/?p=3886
So irrigation is only 1% of the Murray–Darling Basin!!!
The BoM has opened new www pages about the MDB and this “megafact” jumps out.
mdbwip.bom.gov.au/999/#4.6/-31.5/147
1,061,469 km2 total area of MDB.
11,000 km2 irrigated area (2019–20) – 1% of total area.
Our GreenLeft anti-dam brigade that now rules the wide brown land works hard to increase river water wasting to the sea.
I will add data putting MDB dams in true perspective.
Our GreenLeft ALPABC has just published this bad mouthing of Burrendong Dam.
From ‘moonscape’ to ‘oasis’, the pitfalls of controlling water in worsening climate extremes
www.abc.net.au/news/2022-12-20/how-to-manage-water-as-climate-extremes-deepen/101769978
NSW cold records tumbling in mild start Australian summer
We knew as data came in for November that the BoM Australian mean temperature series ACORN 2.2 showed broad agreement with lower troposphere NASA satellite data from the University of Alabama at Huntsville as both showed a cooler period after 2020 – see chart by Perth based Chris Gillham of Scribeworks at waclimate.net/australia-cooling.html We know that Australia is experiencing its third consecutive LaNina and a few years of much rainfall and flooding. As December started there were BoM sourced media stories of heatwaves or forecast heatwaves but I am not aware of any heatwaves happening much. Links below in my comment as editing function is reduced in my main posts.
Eugowra NSW flood history from the 1800’s out of old newspapers
This is a guest article by Lance Pidgeon who has put time into extracting old press reports from Trove the National Library of Australia pages of historic newspapers.
EUGOWRA. MOST CLUELESS FLOOD WARNING ON RECORD? by Lance Pidgeon. see links in first comment below
There is an image from trove missing at the start of Lance’s article –
By chance Our ABC compiled a photo essay “Wiped out and wanting answers – As the residents of Eugowra begin to rebuild their lives after a deadly flash flood saw them clambering onto rooftops, they are also searching for answers as to how the scale of the disaster caught them by surprise. By Xanthe Gregory and Jessica Clifford ABC Central West Updated 6 Dec 2022
Australias hottest day was at Oodnadatta 62 years ago
50.7 degrees C on 2nd January 1960 www.bom.gov.au/climate/extreme/records.shtml
Australias weather records in general are mostly decades old – says nothing in support of “climate change”
Must drive the BoM mad that with all their new AWS and electric/electronic probes that they can not data-mine a hotter day from somewhere, anywhere and back-up global warming.
JFK was assassinated in Dallas 59 years ago
Jack Ruby’s execution of Lee Harvey Oswald among dozens of Dallas cops lead many of us over decades to conclude that the Warren Commission aided & abetted by FBI-CIA-Secret Service-Dallas & Texas cops was the greatest witness bullying & evidence tampering org in US history. Much has been done over decades by US Congressional orgs to search for the truth and nail down lies about events relative to the assassination of JFK 59 years ago tomorrow.
In 2017-2018 there has been ~55,000 JFK assassination related files released by US Archives – anyone can download a 5Mb xlsx file – so we are in another world now where people and orgs loyal to the Warren Commission process have fewer places to hide.
There was a 2017-2018 2 DVD movie set “JFK Declassified Tracking Oswald” produced by the History Channel featuring presenter ex CIA Agent Bob Baer. I do not know if any CIA pers. ever become “ex” but Bob is worth hearing out in the last 2 or 3 epidodes on DVD 2 as he strains to keep faith with Warren that Oswald was the lone assassin while finding evidence he had anti-Castro Cuban helpers.
Oliver Stone released an updated movie last year “JFK Revisited: Through The Looking Glass” which systematically destroys key pillars of Warren. Buy beg or borrow this as the quickest route to updating with modern information from many researchers plus the 2017-2018 files releases.
We should not forget the amazing efforts by pioneer JFK researcher & lawyer the late Mark Lane who in ~1963-1968 interviewed dozens and dozens of JFK assassination witnesses – filming many – giving those brave people a chance to leave their observations for posterity. Most of Mark Lane’s 1960’s research is in his book and movie “Rush to Judgment”. There is a great 1.7Mb pdf of the 1992 edition of “Rush to Judgment” by Thunder’s Mouth Press – that I have for download.
MDB floods widespread but GreenLabor planning huge enviro flows
With floods progressing slowly downstream over such large areas of the Murray Darling Basin surely this is a time that all the various factions that over a decade ago GreenLabor wove into their MDB plan could let the current huge flows work naturally through the system which should result in a huge flushing of fresh water to the sea.
Our GreenLeft/ALPABC reports —
Water Minister Tanya Plibersek says Coalition dam money will go towards secret fund to buy water rights from irrigators 30Oct22
www.abc.net.au/news/2022-10-30/tanya-plibersek-dam-money-go-to-water-buyback-murray-darling/101591002
The Minister seems to be gloating about stopping Morrison Govt dam projects which were already stalled in antidam State bureaucracies and using the $Bns to buy water out of the MDB plan for future flushing downstream to the sea.
Making the MDB a smaller & less important future food-bowl and the wide brown land will be a weaker food producer.
JFK Declassified Tracking Oswald DVD
Following 2017 release of assassination docs from National Archives ex CIA agent Bob Baer features in this 2 DVD set JFK Declassified Tracking Oswald. www.warwickhughes.com/Agri16/JFK-Declassified-Tracking-Oswald.jpg
and back cover – www.warwickhughes.com/Agri16/JFK-Declassified-DVD-back-cover.jpg
Bob and helpers use software to search the thousands of released docs and take viewers along on their investigations in Mexico City, Moscow, New Orleans, Dallas, Miami and points south.
I assume Bob’s efforts are aimed at covering any potential breaches of what the CIA does not want exposed.
The Kennedys and King www pages have published
www.kennedysandking.com/john-f-kennedy-reviews/jfk-declassified-tracking-oswald
a detailed critique of JFK Declassified Tracking Oswald.
I have blogged twice on JFK issues in 2017 www.warwickhughes.com/blog/?p=5398
and 2018 www.warwickhughes.com/blog/?p=6009
Have read and re-read Rush to Judgment by Mark Lane and also have the book on DVD.
A great shame Mark Lane died in 2016.
PM Albo blatant hypocrisy not supporting PEP11
We all remember the multi media items blaming ScoMo Gov for Eastern States (NEM region) “gas crisis”.
This duckduck link finds articles from 2021 and 2022.
duckduckgo.com/?q=Eastern+states+gas+shortage+need+for+local+reservation&t=ha&va=j&ia=web
Bounty Oil have this map of PEP11 and seismic that shows what they think is the best drill target is way nearer Hunter than Sydney.
www.bountyoil.com/projects/exploration/growth/pep-11/
We hear on news that the PEP11 cancellation is being challenged in the courts.
We know world gas prices are at stellar levels.
tradingeconomics.com/commodity/natural-gas
The AEMO Gas dashboard shows our high gas prices in Sydney, Adelaide, Brisbane.
aemo.com.au/energy-systems/gas/short-term-trading-market-sttm/data-sttm/data-dashboard-sttm
How easy it would be for PM Albo or his Resources Minister King to tell a Gov Lawyer to get into this court pronto and say they are joining the case to reinstate PEP11.
Cancel the PM ScoMo secretive, ill considered move to cancel PEP11.
The Feds could also discuss buying into PEP11 with the owners and Joint Venturers.
Actually do something to MAKE A STRONGER WIDE BROWN LAND.
Too easy. Crickets.