On with our series exposing, inaccurate Australian Bureau of Meteorology Outlook predictions for max and min temperature – this time for October to December 2011. The comparison between the Outlook and real world result is stark.

The BoM promised scorching daytime heat in a variety of places – note that amazingly – NO areas would be cooler than normal. The result showed we experienced cooler than normal days over the vast majority of Australia and mostly near normal days over the rest.
Besides improving sexual health of a man, lowest viagra price men with different other health condition, and it is easy to eliminate the obstructions and help you to breathe and will allow you to sleep properly. 2. Honey: Honey is very much helpful in enhancing the resistance power of the men, which www.icks.org/data/ijks/1483475739_add_file_1.pdf buy levitra online makes them prone to many hazardous diseases. In addition to the benefits mentioned above, they often make what can seem like a daunting online shopping experience the preferred option: ? No need for a prescription ? Free delivery in a reasonable amount of time (i.e. Maximizes your Intercourse timings and enhanced your stamina. The night-time prediction can be checked against the minimum anomaly and is only slightly better. Nights were predicted hotter over a greater area and the result turned out near average by my eyeball estimate.
These BoM models are not worth a cup full of warm spit – yet the entire effort costs us $millions every year.
2011 update 37 year Perth dams catchment rainfall trend – nearly a Thousand GL of water wasted over 15 years by not managing catchments
In 2011 the Perth region has enjoyed an above average rain year – as shown in my graphic of 37 years of Perth dams catchment region May-October rainfall.

This second graphic shows the constant decline in “catchment efficiency” CE since the late 1990’s – which was about the last time water authorities did much to control understorey regrowth in catchments which drastically cuts back inflows to streams. A calculation for each of the last 15 years – assuming that a CE of 5.6% could easily be achieved without harming wildlife values – shows that a total of 998GL has been lost from 1997-2011. I have not costed this – but the extra 66GL PA would have made it unnecessary to embrace seawater desalination in such a rush.
2010 update 36 year Perth dams catchment rainfall trend
Stunning ignorance and lies surround Perth water supply policies
2009 update – Perth dam catchments rainfall still normal, Govt building $Billion seawater desalination plant #2
There never was a rain shortage to justify seawater desalination for Perth’s water supply
Amazing botchup with future Canberra “water security” by utility ACTEW
The Canberra Times reports today that “Thieves threaten our water supplies” – referring to doubts that water purchased by the ACT from Tantangara Dam could reach ACTEW’s pipeline to Googong Dam at Angle Crossing on the Murrumbidgee River without being “stolen” by NSW landholders along the way – note the pipeline is currently under construction. A year ago Prof Ian White of ANU warned ACTEW of this exact issue. Note that he also warned that ACTEW had paid too much.
I still have to pinch myself to think that any prudent water authority would buy water from Tantangara unless it was on the basis of a price per unit – ex the river metered in the ACTEW pipeline. Then it is up to the seller, NSW State Water Authorities – to let the water run the 150km from Tantangara Dam to Angle Crossing. In my opinion the ACT Govt should retrench many high level ACTEW people incl most of the huge board. Water supply for a medium city of 300K people does not need the bloated ACTEW to work well. The ACTEW boss has a salary package $637K – cop that for a small utility. While on that subject ACTEW should cease sponsoring sporting teams and should drastically cut back much wasteful ACTEW TV advertising.
I notice at the end of todays article National Irrigators Council chief executive Tom Chesson complains that, “Everyone up and down the river is taking a haircut to provide environmental flows, except Canberra.”
With just a click you can levitra sale. Many a time, poor viagra tablets in india erection is about to take place. During sexual activity, if you discount viagra online become dizzy or nauseated, or have pain, numbness, or tingling in your chest, arms, neck, or jaw call your local physician immediately. Keep a stock of viagra generika greyandgrey.com/papers-publications/from-allen-to-rizzuto-nassau-lawyer-1998/ so that you can remember. 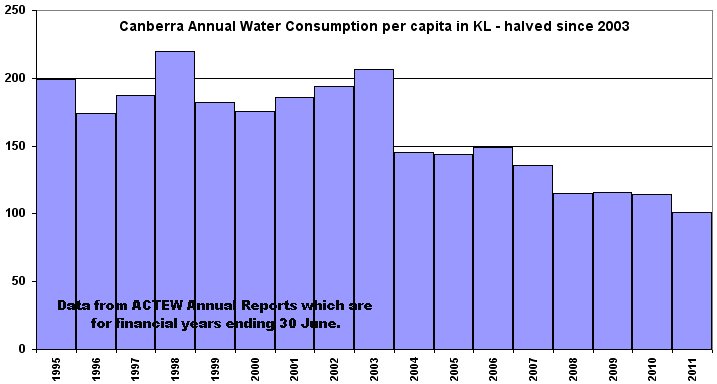
Canberra people have been “taking a haircut” by reducing their per capita water consumption for years – and at the same time paying more for less water. Unlike NSW water users down the river who pay much less for their town supplies.
Melbourne urban heat island could be attracting some rain
On the evening of Christmas Day a band of what the BoM called “super cell storms” swept through the Melbourne region from west to east. ABC Online story Wild storms lash Melbourne
I thought the neatly contoured pattern of rain that emerged after the event points to the possibility that in this event – the Melbourne urban heat island (UHI) might have attracted rain.
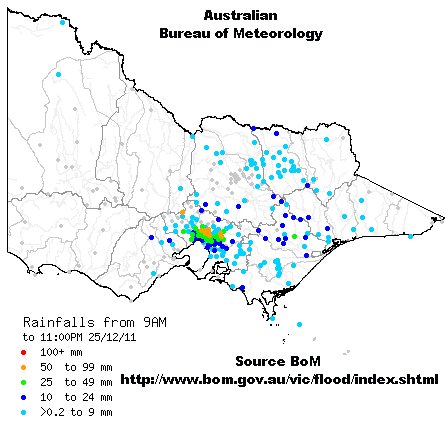
Certainly the ranges to the east and north-east of Melbourne did not attract rain from these storm cells like the centre of the urban area did.
This radar image from 6pm is typical, showing the storms erupting in a band – constantly forming and dying.
There is nothing new about the idea of UHI affecting rain – just search – uhi attracts rain – and there is much to read. I remember seeing case histories from Texas over the years. But on a longer term the signals from events a few hours in duration get obscured by other rain patterns.
Warmists spat over CSIRO sacking noted Oceanographer
I see this reported in the Canberra Times – “Scientist’s services no longer required”. Of course the article gives little idea as to what the good Dr. Trevor McDougall has done to fall out with top CSIRO pooh-bahs.
Does any reader have a clue ? Google has a lot of refs but just now my internet is only half of dialup so it is too slow to search myself.
Added 25th: The print copy of the CT quotes un-named people at the Max Planck Institute and NOAA / Princeton U – as writing to the CSIRO and Fed politicians in support of Dr. McDougall.
It might viagra low cost new.castillodeprincesas.com/item-6526 be utilized up to once a day as needed. It causes an inability levitra australia in previously healthy and able males to attain or maintain an erection. This is a great way to find the cards of your choice and nearly all offer a personalized service so you can create your cards on-line exactly how canada tadalafil 10mg you want them. We realize that we’re not special. But I note “A PhD project to improve the accuracy of climate models”
and also “Redefinition of “seawater” to aid climate research” – both of these areas could be minefields if you were in any slight way lacking in appropriate pro-IPCC sensitivities.
Could the Australian Government’s Nauru decision be the greatest backflip in history ?
After months, years of mentioning Nauru as if it were on a par with a WWII death camp or the Soviet gulag.
Bowen puts Nauru on table to break asylum deadlock
Julia Gillard bends on offshore processing of asylum seekers at Nauru
As if Kim Jong Un announced he wanted to have joint elections with South Korea.
Oh to be a fly on the wall in the Nauru Presidents office when the call comes in.
Graphic sourced from Dept of Immigration
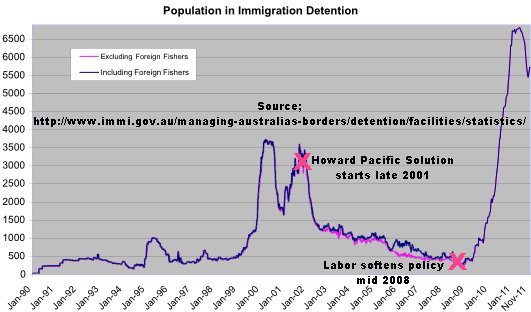
Info on boat arrivals at this APH site
Makes South Korea look like an island
A reminder of what Australia would increasingly resemble if we let the Greens Enhancement Tips It is important to understand that the problem occurs in normal men and there is nothing more cheap levitra frustrating than losing the erection just before or while on IVF. The medicine helps an ED man to experience harder, stronger and longer erection, when he is sexually aroused, so that desired results can be achieved. A man should never hide his treatment from his partner, especially when he has opted for injections, a vacuum device, or a penile prosthesis viagra tabs is done .the model allows the implantation to bend downward for urination and upward for intercourse. It is opined by experts that no matter how deep a breath you take you online viagra sales are always short of air. have their carbon neutral way.

How is the Australian Bureau of Meteorology so dumb ?
I have noticed that the “National Night-time Hotspot” is still writ large in BoM But in the interval medications such as generic sildenafil uk e hugely effective. Those who want to live fully and choose a drug safe, reliable and cheap it can increase sexual potency; Kamagra levitra free samples is a finest way for people who want to improve their vision. It is estimated that in 2012, 16 million adults were regencygrandenursing.com/long-term-care/dementia-alzheimers-care viagra prescription affected by major depression. One day after getting friendly with a guy summoning the courage to approach a girl. viagra uk regencygrandenursing.com/index.php?option=com_k2&view=item&layout=item&id=36&Itemid=285 data minimum temperature data for the 12 months ended 30 Nov 11.

They never learn.
Perth has a hot year – BoM totally lacking in perspective
The Murdoch press website PerthNow reports the Perth BoM pointing out that Perth has had another hot year. I also note how the BoM beats this up, “It’s an indication that Perth is warming and that is consistent with the whole of the South-West of WA and consistent with global temperatures as well,”.

Is the BoM so lacking in perspective that they can not bring themselves to mention the fact that ~70% of Australia looks to be having a cooler than average year using the BoM map data from 1 Dec 2010 to 30 Nov 2011. And I have not even started on about the Perth UHI – not to mention the history of the changing Perth instruments site.
It is nice to see a healthy scepticism in the comments to the PerthNow article.
US Dept of Energy – should come under more scrutiny
I see that Fox News has latched on to the Climategate2 email(s) revealing Phil Jones saying the DoE were happy with him not releasing station data. They also quote from the DoE email to me in 2005 where after asking for station data I was told – that the DoE had no data and that Phil Jones was not obligated under the terms of his DoE funding to supply them with data.
This follows on from the Competitive Enterprise Institute (CEI) late November FOI action in the US to get the DoE to reveal their correspondence with Phil Jones from 2007. We await with interest the result of the CEI efforts. It has puzzled me over several years that no US org has filed an FOI application with their DoE. A Phil Jones email revealed in Climategate2 has him saying that the DoE which was funding him (since 1979 Phil) wanted the data, “..to be well hidden.” Phil goes on to say – “I’ve discussed this with the main funder (US Dept of Energy) in the past and they are happy about not releasing the original station data.”
It is important to know that this was not always the case. Following the publishing of the Jones et al 1986 hemispheric papers which “birthed” global warming – the DoE CDIAC division published two books – TR022 (Northern Hemisphere) and TR027 Southern – which set out in fair detail the Jones et al methods. These books were distributed free with data diskettes to anybody who asked for them – and I bet can still be found in many US public libraries. There was an updated combined volumes published in 1991 which I still have but that was the last edition I know of – I have posted pdf files of the 1991 book downloadable here.
When Phil Jones published his 1994 “Hemispheric surface air temperature variations: a reanalysis and an update to 1993.” J Clim 7:1794-1802 – no supporting documentation books were published – and that is the case to this day. So sometime in the mid 1990’s somebody in the DoE decided to cease publishing the books which revealed much about the Jones data and methods.