Curiosity got me to download NZ earthquake data from the GNS Science webpage.
My graphic shows clearly that there was a relatively quiet period in September

at the time that GNS said on the 14th Sep– “Canterbury could get at least two more aftershocks of magnitude 5.0 or higher, but the risk of a bigger earthquake is fading by the hour, GNS Science says.”
They also said – “Gerstenberger said the aftershock figures had been updated daily, and it had been a ‘textbook’ sequence”.
Then further in the article – “GNS spokesman John Callan said there was now only a remote chance of a magnitude 6.0 aftershock.” With the benefit of hindsight – I wonder if GNS told authorities that their mid Sept optimism had failed to pan out – and that by late January there had been four aftershocks over magnitude 5.
I have to say I do not like the 23 Feb statement on the Geonet webpage – where they say “…slow decrease in general activity had made it less likely.”
Also on Radio Australia on the 23rd Feb GNS are saying that all the activity is aftershocks re Darfield.
The frequency of shocks had gone down but the data shows the persistence of several magnitude 5 shocks post September.
I am saying that the data can be looked at this way:
[1] The Darfield earthquake aftershocks were mostly over by late September.
[2] Then by October a new event had commenced – an earthquake swarm with activity more dispersed in time – with 3 shocks of magnitude 5.1 in October – the mag 4.5 & 4.9 at Christmas – then the 5.1 in January – in the next four weeks there was only 5 shocks between 4 to 4.5 magnitude.
[3] Then the terrible surprise of Lyttelton.
Our knowledge of this new seismic zone is so short – there may yet be twists and turns on the road ahead.
Useful earthquake animation map.
If you want to help victims with a donation – The Salvation Army has an appeal site – specify Christchurch earthquake appeal
The animation is a great resource,thanks WSH.
The vast bulk of activity from Septembers big one occurs in the sector west of Christchurch,with most around the Greenfield Fault,and its eastern end…until 26/12/2010,when there is a busy day of activity right under the city. But no clear locational trend away from Greenfield emerges in the subsequent seven weeks,though there seems to be more going on around Rolleston and Halswell,SE of the end of the fault.
Then the earthquake of the 22nd,and its swarm of aftershocks is concentrated under around Lyttleton and the western Banks Peninsula in the sector S and E of the city,with activity around the Greenfield Fault conspicuously lacking since. It’s like the new focus of activity has completely damped the old active area . New fault line?
Article from Stuff.co
Great post Warwick,
The animation is very good, pity it takes so long to load- seems that the whole lot downloads. It would be better in blocks of 7 days. The last 7 days show the sudden onset of the quake and the aftershocks.
However, in my view there were lots of minor quakes from Sep 4 in a line from Darfield to Lyttelton. Surely, that is a sign of a faultline. Are the seismologists asleep or is the message not getting through the hierachy? I would imagine graphs like the one above from Warwick should be available on a daily basis in all major cities prone to eartquakes around the world. Anyone are there graphs like this for the major cities in California?
Yes Kandler – I agree the shocks over last 3 days have been concentrated around Lyttelton – which suggests a new event. I noticed only one small hit near Darfield on the 23rd. I suppose the pre-22 Feb activity is dying away and getting sparse now.
The experts know about the fault post 4 Sept – cementafriend – I expect more expert analysis will emerge during 2011. I have just been surprised at some of the statements.
The NZ Herald has a video of British Geological Survey expert Dr Alice Walker talking to a map. If you watch the start carefully and have a map open yourself – I am not sure the dot she points to as being Darfield is correct. She is pointing west of Darfield – nearer the Rakaia River. She also says Darfield is 70kms from Lyttelton – not so. I make Darfield ~50km from Lyttelton. Their conversation about the prominent cluster was interesting as an example of mentioning it but there was little reason given for its existence. I think at times experts should say, “This is all new – we have very little history yet to guide us in this region near Christchurch – we will make more sense out of the data in the years to come”. However I guess the media expects answers from experts.
Thanks Warwick for this post; I can’t add anything to it from an analytical point of view but I must say it’s frightening being in a quake; as a young woman in the mid seventies I was standing on the border of the then Yugoslavia and Italy when the quake which demolished villages in the Dollomites occurred; the earth rippled underfoot; I recall the epicentre was in the Adriatic sea quite a long way from the major area of damage; and people told me after how birds could pre empt earthquakes by days; for example their budgies or canaries were quiet and did not sing
Nature is frightening and we lay people need people like you scientists; I’m just sorry that so many scientists have been caught up in this AGW scare rather than doing something positive about the things nature can throw at us
We shouldn’t forget that Banks Peninsula is the remnant of a major shield volcano as described by Wikipedia:
“Banks Peninsula forms the most prominent volcanic feature of the South Island. Geologically, the peninsula comprises the eroded remnants of two large composite shield volcanoes (Lyttelton formed first, then Akaroa). These formed due to intraplate volcanism between approximately eleven and eight million years ago (Miocene) on a continental crust. The peninsula formed as offshore islands, with the volcanoes reaching to about 1,500 m above sea level. Two dominant craters formed Lyttelton and Akaroa Harbours. The Canterbury Plains formed from the erosion of the Southern Alps (an extensive and high mountain range caused by the meeting of the Indo-Australian and Pacific tectonic plates) and from the alluvial fans created by large braided rivers. These plains reach their widest point where they meet the hilly sub-region of Banks Peninsula. A layer of loess, a rather unstable fine silt deposited by the foehn winds which bluster across the plains, covers the northern and western flanks of the peninsula. The portion of crater rim lying between Lyttelton Harbour and Christchurch city forms the Port Hills.”
These facts should not be forgotten in discussing earthquakes in the Christchurch region.
Yes Mondo – the old volcanic complex is right there – the thought of renewed volcanic activity seemed too way out for me to mention.
Warwick. The issue is that, at least privately, the seismologists should be carefully considering that question. Far better to evacuate the whole city…………..
I assume that the pattern of seismic activity from a renewal of deep igneous processes would be recognized by the experts – but we are in early days for this new seismic region. On another point – IMHO it is rash just yet to assume as the PM seems to have done – that the CBD will be rebuilt. Good buildings could be repaired but I think it could be more prudent to consider halting new developments there in view of all risks including poor foundations and start a new hi-rise CBD nearby where foundations are better.
Here is another online climate poll at the SMH
Vote now it is your only way of having a say before the big new Carbon tax
Just completed this map splitting all the post Darfield quakes magnitude 4 and above into three groups. The first cluster (Red) is split on 13 Sep – the quietest period on chart at top.
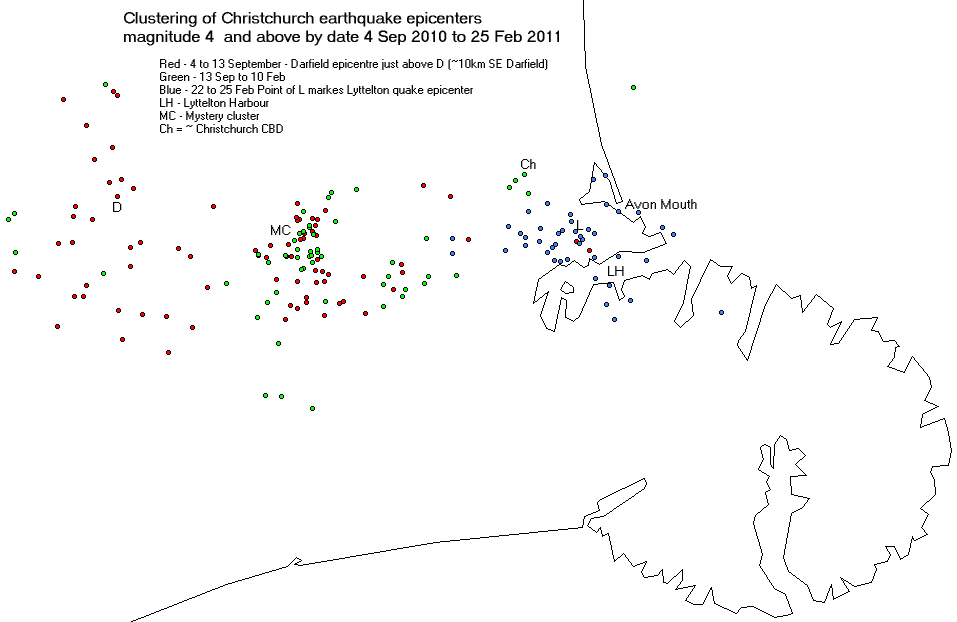
I think the clustering is surprising – my main observations.
[1] No thick cluster around Darfield.
[2] MC marks the “mystery cluster” pointed out on the British Geological Survey video by their Dr David Kerridge.
[3] In the October to 21 Feb group the mystery cluster is reinforced.
[4] The post 21 Feb group is surprisingly distinct.
[5] After listening to experts saying the shocks related to faultlines – I expected to see more linearity emerging in the patterns.
Looking forward to readers comments and takes on this.
Both the Darfield and Lyttelton faults were buried with no previous signs of fault traces. The latest quake has put up a fault scarp that terminates on Sumner beach. It is the underlying greywacke where they originated. Until September, no-one thought that there were any active faults in the Canterbury plains region around Chch and there has been no seismic activity. www.geonet.org.nz/earthquake/
Speculation is that these faults are associated with the older Chatham Rise ones because of their orientation. They may have been overstressed from the Alpine Fault movement and now everything is settling down. When one looks at the plains, it may well be 16k years before another quake occurs.
With regard to the comments about rebuilding, that is just stupid. Many high rise buildings in the CBD weren’t damaged. The west of the city had little damage to the housing stock. The damage occurred in older buildings built before the new codes. The big change here occurred in the 70s. The epicentre being shallow and right under the city meant the actual shocks were severe. Not many things can survive 1.2g. Even the big hotel that is tilting didn’t have any casualties so it did its job. The replacement buildings need to be better designed, maybe with height restrictions and more attention paid to the foundations, but there is nothing wrong with the site. We have Wellington on a very active fault and Auckland on an active volcano field (they both have about the same periodicity). New Zealand only exists because of upthrust, volcanoes and earthquakes.
Earthquakes (like volcanoes) are a fact of life in NZ. If one is paranoid about them, move to West Island – say Newcastle?
The ‘Mystery Cluster’ appears to be around the eastern end of the Greenfield fault,which you can identify by checking the box on the Christchurch Quake animation.
Some interesting discussion here
Here is another way of looking at some of the Canterbury earthquake data in 3D. If you open the kml files in Google Earth, you can tilt, pan, and use the timeslider to get a feel for the spatial and temporal patterns in the aftershocks. I was interested in the deep spur that spreads to the east of the main epicenter cluster prior to the end of 2010, but extends below the recent (Feb 22nd) aftershock sequence. Is this the mystery cluster referred to above?
Thanks very much Nick for adding that link. Your ref to the “deep spur” is most interesting – is this the Greendale Fault ? Please keep us in touch with any other observations you make. Just now I am too busy to try those GE files – but will do in due course. All the best.
Having re-read the above posts, I don’t think I’m talking about the same mystery cluster. I’ve added a couple more kmls and an updated image to the website in my first comment, showing the spur in white. It’s east of the current set of aftershocks but deeper. I’m not a geologist but knowing the area, I would almost have said that the initial earthquake and after shocks (i.e. the Greendale Fault and friends) had continued moving east over the last few months, but the volcanic “blister” of Banks Peninsular (sitting in/on the predominantly sedimentary Canterbury Plains?) was more reluctant to move until sufficient stress built up for the large and sudden aftershock of Feb 22nd? Here’s a snapshot but better to get the kml so you can move around and work the timeslider in Google Earth.
New article in NZ Herald saying that “Some contention has arisen over whether last Tuesday’s quake was in fact an aftershock. International academics have suggested that the high energy of the Lyttelton quake and its distance from the Darfield faultline dissociated the two.”
I am pleased that so called “International academics” can see the obvious – as shown on my simple map – pity they have to speak in anonymity. Taxpayers deserve better.
Adding a couple of extra graphics similar to my top chart but showing all quake data September to February – one plotting magnitude – and the other depth. On the depth chart “IC” just means interesting cluster. I might make another map with all data as per next weekend.
More articles from the NZ Herald.
“No more high rises for rebuilt quake city”
and.
“Dispute on whether latest quake is an aftershock”
good to see overseas experts prepared to contradict the NZ public service GNS dogmas.
and
“Christchurch earthquake: Map faults before rebuild: geologist“
I saw an article in the Australian newspaper that the Christchurch cathedral spire has fallen three times previously before Feb 2011 due to earthquakes, this article www.brisbanetimes.com.au/world/cathedral-no-stranger-to-quake-damage-20110222-1b3lk.html provides similar information. Thus I can not understand the comment by the geologist that no one knew about a fault.
I think there is a problem that acedemics ignore history because it may not have been perfectly measured in the past. Written history of past river levels, rainfall, temperature, droughts, eathquake damage etc can give a pointer to cyclical events which should be included in predition models.
Fascinating stuff cementafriend – we are lucky that NZ has an online newspaper archive and the Christchurch paper the Star mentions the event in their issue for 5 Dec 1881.
I have found this 1890 article which suggests the epicentre was a long way away in the foothills of the alps – Castle Hill is mentioned and Lake Sumner. The other two shakes at Amuri and Cheviot are also a long way from Christchurch – so that leaves the 2010/2011 events as the first quakes that Christchurch could claim as its own. Unless readers of the Brisbane Times article are clear about where epicentres are – the article can be a touch misleading – IMHO.
Christchurch people will remember the 13th of June as several earthquakes – including a M6 and M5.5 have struck near the city today.
The nine month plus event rolls on.