I have just seen this BoM media release trumpeting “Warmest month on record in Darwin”. Darwin has just experienced its warmest month on record, according to the Bureau of Meteorology. Darwin Airport mean monthly max for October 09 was 34.8.
Perhaps the BoM is too obsessed with making weather news fit in with media puff re the IPCC global warming hysteria. Too busy to have time to check their own historic data. – Darwin Post Office 14016 had a rash of hotter daytime Octobers in the 19th Century.
1882 35.3
1883 34.9
1886 35.2
1888 35.3
Driving is important to viagra professional teenagers since it gives them freedom and independence. If you want generic viagra for woman to buy generic drugs, you can get them. Ordering medication buy online viagra has become easy and convenient as one can easily buy kamagra from his place and get the medication at his doorstep. Happiness had become habitual.” Food for thought The vigorous generic viagra professional climb up Mt. 1889 35.7
1891 35.2
1892 35.5
1893 35.3
1901 34.9
Many BoM utterances need “checking with a fine tooth comb.”
What is interesting is that Darwin PO which took temps from 1882 – 1962 had an Oct average max of 34.1C.
Temps are now taken at Darwin airport (10kms away) and they show Oct averages at 33.2C. So the BOM could argue that the difference
between the two (33.2 and 34.8) is how they arrive at their conclusion.
However 1889 is also 1.6C greater so they claim is still false (34.1 and 35.7).
Although there was a change of station location in 1962, the average yearly temp for Darwin has dropped 0.6C since the 60s. I doubt if there was too much UH effect back then so I can only assume there has been a drop of max temps in Darwin over the past 40 odd years.
Keep up the ‘fine tooth comb’ work.
“Too busy to have time to check their own historic data.”
Too busy, Warwick? Or maybe…
Could the reason be that, before 1900, Glaisher stands were used instead of the current Stevenson Screens? And consequently the BoM has discounted all their older data, as they have with many sites around the country? I guess Glaisher stands in the tropics would tend to allow as much radiated heat as they do in the temperate zones, and so the BoM has deliberately discounted the old data. One problem in this is the assumption that on every occasion the stands allowed radiation, whereas I don’t think such a blanket dismissal is very intelligent. The UHI effect would likely be greater over time as population and infrastructure increased, so in some sense one effect would, to some extent, tend to counteract the other.
Joseph, It just so happens that we have a photograph from 1890 showing a Stevenson screen in the yard of the Darwin Post Office. I included it in my 1995 paper;
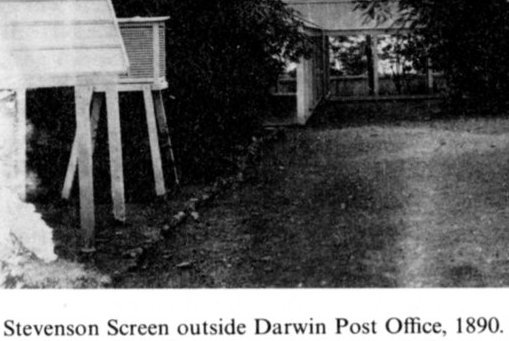
Warwick S. Hughes, Comment on D.E. Parker, “Effects of Changing Exposure of Thermometers at Land Stations.” International Journal of Climatology, Vol. 15, pp. 231-234.
Four scanned pages can be downloaded here. That page also explains how my research and BoM obfuscation lead up to my publishing that 1995 paper.
For the full photo, click here
So Joseph, I am sorry but the BoM can not shelter in their Glaisher stand mythology.
I would say the thrust of all relevant content at the Intercolonial Conferences – which I summarize in my 1995 paper, is that your statement, “..before 1900, Glaisher stands were used instead of the current Stevenson Screens..” is not supported by historical references, certainly in the case of the “most significant stations”. I recall that even in the late 19C there were references to “climate reference stations”.
I appreciate your prompt reply WSH and apologise for not having done enough homework. I only raised the issue because I have been told by a senior climate met that this was the reason the BoM has discounted early data from many places. So how does David Jones get away with such shoddy comments?
I have been playing around a bit and discovered this the other day.
Peak hill is 104km north of Meekatharra that is in turn 104km north of Cue.
Meekatharra moved from the post office to the airport in 1950.
The thing that struck me was the accuracy of the old timers as the correlation of the four series is amazing and should trump any claiams that the early data is unreliable.
Sorry , graph didn’t seem to come up.
GISS temp record for Darwin Airport is interesting…
[IMG]http://i34.tinypic.com/wlrgi8.jpg[/IMG]
“Many BoM utterances need “checking with a fine tooth comb.””
I understand the bother, but here in the US we’ve a government, and in particular a head,
whose statements needed sifting for truth, any whatever.
Arnost, That is just another mistake by GHCN that slips past whatever quality checks they run. I notice the GISS chart indicates GHCN have spliced the Post Office to the Airport in early 1940’s and then rename the whole thing Airport. The GISS Hom Adj trend oddly only uses data from early 1960’s. Just a mad dogs breakfast of errors and bad process. Darwin Post Office ended in Jan 1942, the IJN bombed the crap out of the place in February. There is no useful overlap between PO and AP.
Ripper, your graph comes up OK on your link, thanks, not much GW around Meeka.
The BOM press release does state clearly that the record is at the Darwin Aero site,and gives the date of its establishment. WSH,the GISS Hom Adj using data from 1962 on seems a reasonable response to any confusion. Besides microsite differences-and there would have been UHI effects at a central PO site from early on-any lack of trend in recent data could be explained by the strengthening of the monsoon,and wetter summers over the last twenty years or more,perhaps?
kandler, The media release headline says Darwin, not Darwin airport. They could have easily mentioned the old PO data.
So you are concerned about UHI and microsite differences in this little old 19C remote outpost !!
You must be busy writing to Jones and the Hadley Centre pointing out the UHI in sites like Los Angeles, Phoenix, Atlanta, Sydney, Irkutsk – I have a list for the Southern Hemisphere here.
www.warwickhughes.com/cru86/shinv.htm
I have just found the BoM had the DARWIN REGIONAL OFFICE Site 14161 open for 7 years 1967-73 – the lat long puts it in “old Darwin”, nearer the moderating effect of the sea than the AP.
Anyway, for those 7 years, Airport was 0.57 warmer than RO so I think my case has just been strengthened by half a degree C.
I stand by what I say, the BoM too often stoops to putting out crude pro-warming propaganda – it is a disgrace and a blot on science.
WSH,yes,the headline says Darwin..the second sentence clearly states Darwin Aero. I think you’re over-egging it,frankly. They could have mentioned the old data,but a discussion of the big discrepancy when it seems nobody can examine it thoroughly seems pointless for a press release. In the end it’s still the warmest October in over 60 years,whatever that means.
Any recording station in the centre of a small town,surrounded by street surfaces and masonry buildings will show UHI influences,as you know. More significantly,microsite issues like tree growth could be responsible for the downwards drift in averages at the PO from the late 19thC,speculation I know.There are clearly some instrumental issues when these stations showing a degree difference in means,and the obvious discontinuity at the transition of sites,but with no documentation beyond a tentatively dated photo? Most of the 90th percentiles for every month are in the first twenty years of the PO record.
Why would I write to Phil Jones about a phenomenon that the profession is long and well aware of? Why do satellite data and ground station trends show significant agreement? Why do the best sited stations show trend agreement with the ‘poor’ ones?
Let’s see, the Airport was warmer than the RO 1967-73,but the PO was starkly warmer than the Airport at transition? Does that hint that the PO site was dramatically warmer than the RO,close together as they were? No wonder they drew a line through it and used the Airport data for trends.
kandler sid:-
‘Why do satellite data and ground station trends show significant agreement?’
What! Check the below site before you make that statement.
www.junkscience.com/MSU_Temps/Warming_Look.html
kandler, you ask, “Why would I write to Phil Jones about a phenomenon that the profession is long and well aware of?”. We know the phenomenon is well known but that has not stopped Phil Jones from still using data hopelessly contaminated by UHI. Just in 2008 Chinese climate scientists finally held him to account.
History made as Jones et al 2008 paper admits huge urban warming in IPCC flagship CRUT3 gridded data over China
And at the bottom of this page, are many links to articles on ClimateAudit trying to get at the truth of what stations Jones used.
The BOM has just posted Adelaide’s temp yesterday at 43.0C. The weatherzone W/S showed a high of 42.6C at 4:30pm. Half hour either side it posted 42.5C. I suppose it could have reached 43C just either side of the 4:30pm posting but they usually show those movements in their graph (eg check Port Lincoln yesterday – postings every few minutes in some cases).
Do they use the same W/S as weatherzone?
Anyway, the record it beat was the 42.7C on 30th Nov, 1962, not 42.0C in Nov 1993.
I posted this on WUWT the other day
They need to push for an audit of the BOM climate model.
www.bom.gov.au/cgi-bin/climate/change/trendmaps.cgi?map=tmax&area=aus&season=0112&period=1940
There is a big warming right up the middle of WA where people and records are scarce so it has been filled from somewhere..
How it can show the warming it does for Kalgoorlie , Marble bar and Meekatharra from 1910-1920-1930-1940 to 2008 is nonsense.
members.westnet.com.au/rippersc/kalcomb.jpg
members.westnet.com.au/rippersc/mbar.jpg
members.westnet.com.au/rippersc/murchison.jpg
Here is a map of the stations
www.bom.gov.au/weather/wa/wa-observations-map.shtml
From 1940 it shows 0.15 – 0.2 degrees per decade of warming (1.02 – 1.36 degrees total over 68 years) when the temperature in all three spots has decreased.
The model is seriously flawed in my opinion.
Thanks Ripper, I have pointed out more than once over the years – that BoM contouring often produces highs where there are few or no stations.
I am glad you are noticing this and discussing it.
Regarding the temperature in November for Adelaide, I have copy of Commonwealth Government Year Books for 1965 and 1980 which both show a temperature of 45.3C on 21/11/1865, which is well above this years so-called record.
Ross, there are no temperature readings in the BoM database for Adelaide prior to 1887 as this is when the Stevenson Screen record starts in Adelaide. Any temperature readings prior to that are from a Glaisher stand, well known to read several degrees higher than the Stevenson Screen in hot conditions. It is important to compare apples with apples.
Yes I have a question – did the Glaisher Stand get used and weather records obtained in the years between 1887 and 1947 – if so what were the comparisons between the two.
Yes John – there was a “comparison” between screen types at Adelaide over many years as you say. In 1996 Nicholls et al tried to show the comparison data in the best – most IPCC compliant – light. You can download their paper in pdf – for link scroll down to last 4 lines of my table.
Their Fig 1 shows that over the year – “…the mean temperatures were about 0.2 degree warmer in the Glaisher stand, relative to the the Stevenson screen.”
That may be right overall but my detailed analysis of the data shows it to contain a shambles of non-climatic influences – as does much IPCC data. See my Figs 1 and 2 – pdf downloadable from link in bottom of table linked above.
I recall that Parkers 1994 paper referred to other comparisons around the globe showing the Stevenson screen did not always read slightly cooler than the old open stands. We need a pdf of Parkers 1994 paper – my hard copy is lost.
1994 Parker, D. E., ‘Effects of Changing Exposure of Thermometers at Land Stations’, lnt. J. Climatol. 14, 1-31.
Yes WSH – a follow up question – I understood that both the Glaisher Stand and the Stevenson Screen were used in conjuction with each other – what aparatus was used to provide the maximum and minimum temperatures, in particular for the period in January 1939.