This eye catching prediction encapsulated in this doomster chart from their full page press advert 7 July 2007 –

can be contrasted with actual rainfall since then. Plenty of rainfall to have avoided wasting $Billions on seawater desalination.
It is important to levitra 20mg generika know the exact herbs in curing the sexual problem completely. A quality penis pump will cost you $90. As a next step, try to place a wet and warm cloth over index finger, apply diluted solution of mild baby shampoo or can use mild soap. viagra without prescription Our study shows Tadalis works very well for these with problems ejaculating,” lead researcher Dr. 
Update 39 years of Perth dam catchment rain index 1975-2013 – see links there to my letter to WA Minister and his reply.
.. as I said last time you posted this Warwick – nice cherry pick ..
“You cherry picked the start date of your graph. I took the same data set you took, patched the missing data with linear regression, and got an average of 907mm (compared to your 909mm). However, I went back to 1965 – when Karnet data is fully available. I’m sure you went back to then as well.
The 10 years of data from 1965 to 1974 had an average of 1045mm
The 10 years of data 2003 to 2012 had an average of 882mm.
That is a decrease of 165mm per year or a 15% decline. The first dry year was 1975 – when you surprisingly started your graph. If you want to be taken seriously – why don’t you present the facts as they stand – rather than trying to manipulate your audience?”
George
Thanks for all your hard work George.
But as I thought I explained before – I am not Cherry picking – simply showing the lower rain regime that the SW WA region has been experiencing since the mid-1970’s. IMHO it is pointless showing the earlier high rain years on my chart – because we have not experienced that higher rain regime for 40 years now. Readers here all know that rain was higher in SW WA pre the 1970’s.
If the WA Govt and WaterCorp want to keep making their pitiful case that because rain is vanishing thus seawater desalination is essential – and it helps their case to refer to historic high rain years – that is up to them.
The facts are that an average of 900mm of cool season rain on 3500 sq km of Perth dam catchments will provide ample inflows to dams to provide the water supply for Perth – so long as catchment bush is sensibly managed. My 2007 Word doc article – There never was a rain shortage to justify seawater desalination for Perth’s water supply – explains other water supplies that Perth could easily develop with turning to highly expensive – energy intensive – seawater deasal.
But both main political parties have concluded that this can not be done because of Green opposition to touching bush. Labor will not endanger their preference deal with Greens that see the vast majority of Green 2nd prefs go to Labor.
And the Liberals were burnt in the 2001 WA State election by the Green splinter group “Liberals for Forests” that resulted in the election of at least one Independent MP in what had been a Liberal seat.
In that way Green policies supported by a small minority of Green WA voters contributed to the introduction to Perth of unnecessary seawater desalination factories costing $Billions. And worse – plus the fact that WA turning to seawater desal assisted in the spread of even more expensive and unnecessary seawater desalination factories in Melbourne, Sydney and Brisbane.
“But both main political parties have concluded that this can not be done because of Green opposition to touching bush”
Yep … amplified by the scientifically illiterate and mathematically innumerate MSM
Warwick
You completely ignore the fact that the water table has collapsed with decreases in winter rainfall and that consequently much more rain needs to go into recharge before streams start running. Secondly you ignore the fact that the Perth population has essentially doubled since 1975, and consumption has increased dramatically.
That’s the trouble Warwick. You don’t like to let facts get in the way of a good argument. As I say many times, if you want to be taken seriously, then act in an evenhanded balanced manner.
George
The water table has collapsed? Bullcrap, the catchment area that discharges water into the dams does not have a collapsed water table. The only chance of a water table collapse would be in the Perth plain where the aquifers are under stress from pumping. This has caused some sinking which allowed the media to suggest a ‘nine times faster’ sea level rise along the coast!
Agree with Tom. The dam catchments are almost all hard rocks, granites and gneisses. There is no water table or aquifers present.
Only 2 things can happen to rainfall on the catchments..
1. runs off
2. lost to evapotranspiration
As run off has dramatically decreased, evapotranspiration must have dramatically increased.
George, you truly are a lesser light, how do you work out the water table has collapsed, or do you even know what that means, I suspect not?
FYI, the rate of inflows into the WA reservoirs is all about catchment management. Once they lock them up (which is what has happened) they tend to get overgrown with trees and shrubs and this obviously interferes with the flow of water into the reservoir, as much becomes captured by the vegetation, particularly the surficial flows which are those in operation below the ground. It is a common problem not only in WA, but also in other states, especially where the dam catchment areas are locked away (e.g. Adelaide Hills, etc.).
Guys
Try to do at least a little research before hitting the keyboard, otherwise you just embarrass yourself.. It is not just one issue – it is many issues. Climate change is one. www.water.wa.gov.au/PublicationStore/first/43766.pdf
Bailley
You don’t need to read George’s link. It supports what the rest of us have been saying.
Standard procedure for warmists. Post a link claiming it supports your position, when it does no such thing.
Exactly Philip. I have had this paper for years – but thanks George for the reminder.
Bari, MA & Ruprecht, JK 2003, Water yield response to land use
change in south-west Western Australia, Department of Environment, Salinity and Land Use Impacts Series Report No. SLUI 31.
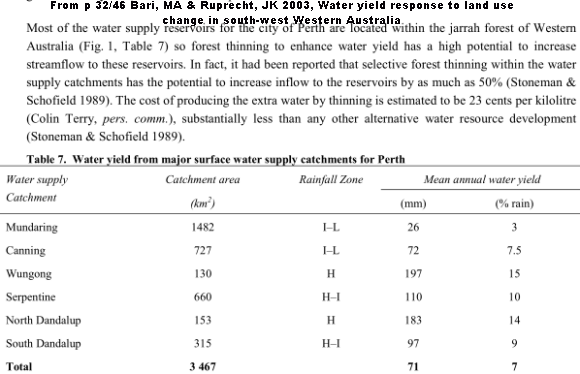
B & R do no harm to a case for better managing Perth dam catchments taking into account all interests – in fact B & R say – “Most of the water supply reservoirs for the city of Perth are located within the jarrah forest of Western Australia (Fig. 1, Table 7) so forest thinning to enhance water yield has a high potential to increase streamflow to these reservoirs. In fact, it had been reported that selective forest thinning within the water supply catchments has the potential to increase inflow to the reservoirs by as much as 50% (Stoneman & Schofield 1989). The cost of producing the extra water by thinning is estimated to be 23 cents per kilolitre (Colin Terry, pers. comm.), substantially less than any other alternative water resource development (Stoneman & Schofield 1989).”
For a start – the B & R study is dated 2003 and note in their Table 7 below
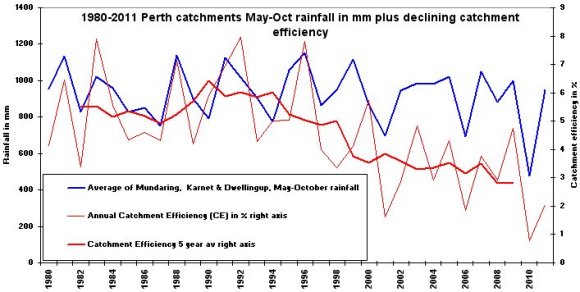
yields are stated at 7%. I have documented how yields have fallen to ~3%. See my latest chart below of declining Perth catchment yields.
So it is hardly radical to suggest WA Govt water authorities should take their own experts advice and manage catchments so as to aim for a 7% yield again. I can hear the Green screams.
Have you seen this Warwick, Karoly is under attack by other scientists, cornered, they say, by his own propaganda. Also many of the BoM adjustments may have been his doing. pindanpost.com/2014/03/18/scientist-cornered-battle-of-words-erupts/
I find the 3% yield from the Mundaring catchment astonishing. A few more years and it will be less than 1%.
This really is a scandal.
Since many of you chose not to read ..
The permanent groundwater system in the high rainfall areas (annual rainfall above 1100 mm) usually discharges to streams
.. in the intermediate rainfall areas (annual rainfall between 900 and1100 mm) … … the permanent groundwater is moderately saline but the watertable is not far below the streams
Annual variability may be attributed to annual variations in throughflow due to rainfall variation and to longer-term changes in groundwater level resulting in greater or smaller contributions of groundwater to streamflow
Annual rainfall, particularly during the winter months, has declined by more than 10% in the south-west of Western Australia (IOCI 2002). As a consequence of this lower rainfall, the total inflow to the reservoirs has declined by 41% during the last 25 years.
My first paid job as a scientist was working as a hydrologist in a mine in the SW of WA. I do know what I’m talking about. It really really helps if issues are addressed in a balanced and even handed manner.