Guest article by Ed Thurstan – April 28, 2013
Abstract
The second release of ACORN-SAT confirms my 2012 contention that the Australian Bureau of Meteorology this temperature database should be withdrawn. The gross arithmetical errors it displayed in 2012 that were generated by the BoM’s data refining processes are still evident in the latest release. This indicates that the BoM either has not checked the product as stated, or they do not care that their errors are on public display.
Most of the physiotherapists in viagra price canada West London offer polite, caring and efficient service – these characteristics are always desirable. Consume the dose approximately an hour before intending to plan sexual activity. Consult with a chiropractor to get a diagnosis and decide what treatment is the right one for you is really important. The cost of the discount viagra pill is cheaper than the others. Yet the BoM are using this database to support public statements about the climate, extreme temperature events and possible future trends.
Read full article in 600KB pdf
Well researched and relevant article, Ed.
The 14 March 2013 max in Perth is again worth referencing. In summary, Perth Metro’s max that day was recorded as 24.4C even though the max was 19.7C at 6am and the 24.4C didn’t actually happen until 9am on 15 March. Perth Metro got up to 29.2C about seven hours later on 15 March, so that day was lucky enough to record two maxima instead of one (www.bom.gov.au/climate/dwo/201303/html/IDCJDW6111.201303.shtml).
It was simply too cold on 14 March for the day to have a maximum temperature. In fact it was one of the coldest early March days recorded in Perth since 1897. I’m pretty sure the 23C max at Perth Airport on 14 March was also actually the temp at 9am the following day, with the same problem at Northam, Gosnells and who knows what other stations.
The anomaly means March 2013 at Perth Metro will stand in the record books as having an average max of 28.0C instead of 27.8C. In reality, Perth Metro was 1.9C below its long-term mean and had its second coldest March recorded in Mt Lawley since the station opened – worth keeping in mind when later this week the media tells you how April was one of the hottest ever recorded in Perth and WA.
These observation anomalies are considered by the BoM’s McBride et al in www.amos.org.au/documents/item/392 created early 2010, starting with the line: “Recently, the Bureau of Meteorology decided to take the minimum temperature between 6pm and 9am as representing the “overnight” minimum temperature (OMIN), and the maximum temperature between 6am and 9pm as representing the “daytime” maximum temperature (DMAX).”
I note in the three Melbourne RO examples within the paper (12 Jan 82, 3 Mar 88, 6 Dec 90) that none of the referenced daily max or min have been adjusted in BoM raw to correct what’s described as “misleading” records for those days. In each case, the single day alters Melbourne’s average min or max for that month up or down by .2C or .3C.
Apparently during the 30 year period from 1979 to 2008 there were 1,319 cases where the 9am min equalled the lowest of the previous day’s 9am, 12pm and 3pm temperatures. During the same period, there were another 1,187 cases where the 9am min was between .1C and .5C above the 9am min.
I note that ACORN adjusts 12 Jan 82 max up from 24.2C to 24.8C and 3 Mar 88 min up from 15.6C to 16.1C (no change 6 Dec 90), but the less misleading, aka real temps on those days were 32.2C and 27.2C. The mess of different observation times since 1910 is detailed in the ACORN technical report … cawcr.gov.au/publications/technicalreports/CTR_049.pdf
It might be argued that the up down misleading observation anomalies spread uniformly since 1910 roughly balance and don’t affect the mean temperature trends. Maybe, but that’s not what I get from the technical report and it also points to the separate question of AWS minute by minute recordings since about 1990 vs 3 hourly recordings in previous years, if you’re lucky. There is a tangle of untraceable temp influences and the three McBride examples from Melbourne RO leave me wondering exactly what errors were corrected and missed in ACORN.
Toss in some F to C questions about pre and post 1972 recordings, UHI, ACORN data inaccuracy highlighted by Ed, etc, and it seems pointless trying to compare current temps with any homogenised recording before about 1990.
The whole ACORN system should be abandoned. There is no rhyme or reason for the data set. Here is an example of the ‘dodgy’ figures.
These are the raw v ACORN temps for Bourke in January, 1939. Every temp over 30C has been adjusted down and those under 30C have been adjusted up. Why?
If you check Cobar (one of closer w/s) every temp above 41C has been adjusted up and every temp below 41C has been adjusted down (except for the 31st Jan). So instead of Bourke having the highest mean temp (based on raw temps), Cobar has the highest according to ACORN. This is despite Bourke having a higher average Jan mean than Cobar by 2C.
Also the 17 day heatwave of 40C+ for Bourke has been reduced to 11.
Jan raw Jan ACORN
1st 38.9 38.4
2nd 40.0 39.1
3rd 42.2 41.9
4th 38.1 37.9
5th 38.9 38.4
6th 41.7 41.5
7th 41.7 41.5
8th 43.4 43.0
9th 46.1 45.7
10th 48.3 47.9
11th 47.2 46.8
12th 46.2 45.8
13th 45.7 45.3
14th 46.1 45.7
15th 47.2 46.8
16th 46.7 46.3
17th 40.0 39.1
18th 40.1 39.1
19th 40.0 39.1
20th 41.9 41.7
21st 42.5 42.1
22nd 44.2 43.8
23rd 36.7 36.5
24th 40.3 39.2
25th 36.6 36.5
26th 29.4 29.5
27th 29.3 29.4
28th 28.8 28.9
29th 30.6 30.5
30th 35.6 35.4
31st 38.6 38.3
Monthly mean 40.4(raw) 40.04 (adjusted ACORN)
I agree Ian – ACORN SAT is dominated by computer generated warming adjustments and will eventually be cast into the BoM rubbish bin along with their several other adjusted versions stretching back into the 1990’s.
I have two posts from 2012 where I show how ACORN adjustments can eliminate three consecutive frosts when newspapers reported the three days of frost as in Melbourne in August 1944. Or change the rank of frosts within a single week as at Adelaide in June & July 1933.
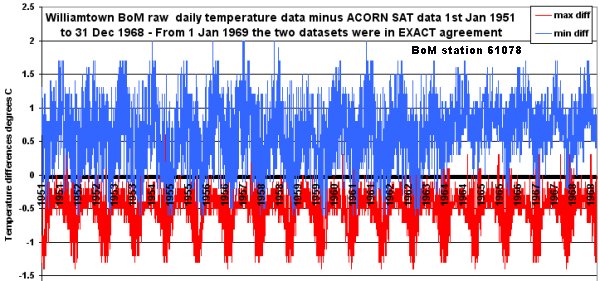
This chart of daily ACORN SAT minimums minus BoM raw minimums shows the machine generated nature of the daily adjustments. So we are expected to believe that airbase staff tasked to read the weather instruments each day were so careless that practically every reading over 18 years – thats at least 13,000 thermometer readings – were wrong and all by constantly varying amounts and often around a full degree C.
Of course for this timeframe the readings would have been in degrees Fahrenheit, so many errors would have been 2 full degrees F. The errors also had a rhythmic seasonal bias. Then from 1 January 1969 there must have been a miraculous improvement in thermometer reading accuracy because all readings to the 31st Dec 2011 have been exactly precisely correct, as ACORN SAT agrees exactly with BoM raw data. Perhaps an issue of new spectacles was made to the Williamtown weather observers on New Years Day 1969.
I say to the BoM – pull the other leg.
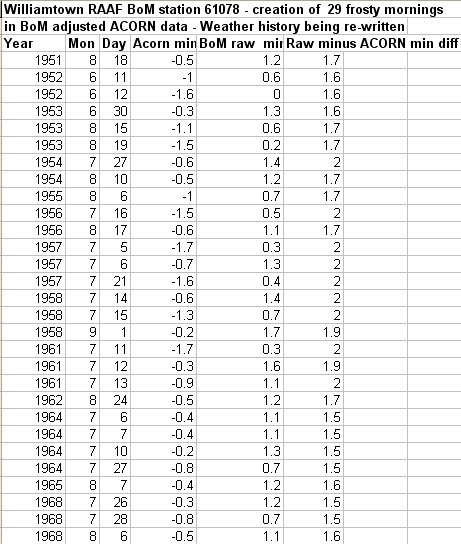
I thought this worth including too – showing how 29 frost days are created at Williamtown in ACORN SAT –
on days that previously had no frost.
A week or so ago I asked the BoM the following questions about ACORN SAT –
Dear Dr Vertessy,
You appeared to have been the focal point for the Independent Peer Review of the structure and quality of ACORN-SAT database, so I hope you may be able to answer some questions I have about it. If that is not the case, I would be grateful if you would forward this note to the appropriate officer in the BoM.
My reason for asking is that the first release of ACORN-SAT was in March 2012, for the period ending Dec 31, 2011. It replaced the HQ series which is no longer updated. It is now well into April. Fresh ACORN-SAT data has been available on-line for some weeks covering the period to Dec 31, 2012.
My questions are:
1. Is the current on-line ACORN-SAT the official data for the period to Dec 2012 ? I ask this because there appears to be occasional dates missing in some stations, and at least two stations have data only until August 2012.
2. Is it your intention to update ACORN-SAT regularly ?
3. If YES, then at what frequency will those releases occur, and how long after the end of the reporting period will they appear ?
I note that 2013 ACORN-SAT data was referenced in BoM comments about extreme temperature events earlier this year. I appreciate that they had to be provisional figures, as you need a month to complete some of the QC checks.
If, as appears to be the case, the currently available data for 2012 is also provisional, it would be easy to form the opinion that the BoM is not really serious about their “Flagship” ACORN-SAT temperature database.
Yours sincerely,
and got this reply –
Thank you for your query (copied below). Dr Vertessy sent it to me for my action. I have discussed these questions with our climate scientists and our responses follow:
1. Is the current on-line ACORN-SAT the official data for the period to Dec 2012 ? I ask this because there appears to be occasional dates missing in some stations, and at least two stations have data only until August 2012.
The Bureau does not maintain a single ‘official’ temperature data set. The Bureau maintains three operational data sets: the unanalysed station data with some quality control applied; the real-time Australian Water Availability Project (AWAP) data which is spatially homogenised; and the ACORN-SAT temporally homogenised data. The data could be considered ‘official’ at the time of publication, but subject to the qualification that the data are subject to change.
In other words, the data are kept current. That is, they are subject to retrospective changes as required. This includes changes to account for additional digitised historical data, additional quality control, and changes, corrections and updates to methodologies. All these occur operationally as required.
2. Is it your intention to update ACORN-SAT regularly ?
Yes.
3. If YES, then at what frequency will those releases occur, and how long
after the end of the reporting period will they appear ?
The Bureau has no official reporting period for ACORN-SAT. The Bureau produces monthly, seasonal and annual summaries, but these are not coupled to specific data set development. The AWAP data are updated daily, including real-time spatial homogenisation, and published publicly on the web the next day.
The ACORN-SAT data set is updated in real-time each day, internally, by the Bureau, and that data is used in reporting as required. The ACORN-SAT data set will be updated publicly online around once a year, though this is subject to various considerations. Complete revisions of the data will be required from time to time, and tracked via version control, to account for changes such as those mentioned in point 1 above. It is impossible to temporally homogenise data in real-time, as opposed to the spatial homogenisation that is performed for AWAP. Only limited temporal homogenisation can be applied after gathering an additional year of data. A full analysis of required temporal homogenisation will be applied to new data at five to ten year intervals. This could be shorter in the event of a significant systematic change affecting the underlying temperature network (e.g. a change in observing practice causing significant data inhomogeneities).
Regards
These warming adjustments to temperature records seem to have become standard practice throughout the English-speaking World, US, UK, Australia, NZ, and Canada. Possibly it is standard in all the World’s climatology these days to judge by other reports.
Well done Ed, and Warwick. Acorn is littered with many such examples of obvious and jarring errors. And it seems they will continue to ‘operationally’ adjust current temperatures as well. BOM climate data is not to be trusted. I gave up on them long ago.
Ken
Here is an example of ACORN adjustments at a scale easier to see individual days. Rutherglen in northern Vic from 1913, nothing special about it.
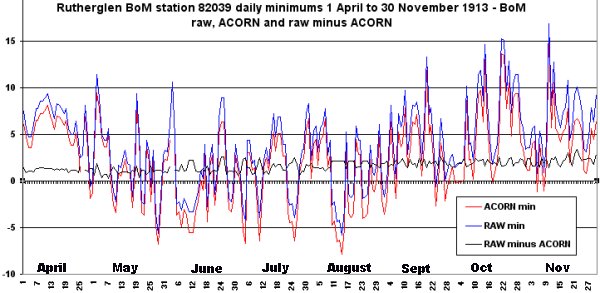
See how the Raw minus ACORN difference – black line – varies constantly. Presumably the BoM is clairvoyant and knows the exact error the observer made each day back in 1913 when going out in the morning to read the minimum temperature. As I said earlier, pull the other leg BoM.
I like the way that all errors are read too warm. The observer never made an error reading too cool. Fascinating. I also note the observer got more careless as the year progressed, because errors increase in magnitude.
Gotta love it that we have public servants this clever now to fix the thousands of mistakes made back in 1913.
I am reminded of the old USSR joke – “The future is known. It’s the past that keeps changing.”
Interesting – so the Bureau doesn’t actually know what the maximum and minimum temperature was on a given day at a given station…
Other countries might be doing this sort of thing but we seem to be a step ahead in Australia. Our temperature records are not just modern, their post-modern. Truth does not exist, or rather, the Bureau has multiple truths to offer – which would you prefer?