As reported by the ABC – Antarctic melting 10 times faster than 600 years ago –
The paper is paywalled at Nature here. Abram et al 2013 – Acceleration of snow melt in an Antarctic Peninsula ice core during the twentieth century
I was kindly given a pdf by one of the authors. Being curious to know if the MWP has been detected in the Antarctic I spent 5 seconds with Google and found these summaries at CO2 Science showing that several studies have detected the Medieval Warm Period in the Antarctic and also around the Antarctic Peninsula. The tip of which is not within the Antarctic Circle.
In most cases, off-label prescriptions are order cheap levitra only written when a person also suffers from nervous system disorders. Many of cipla sildenafil these products are actually worthless, due to low libido. It helps to gain fuller cheap 25mg viagra unica-web.com and firmer erection. But after the invention of Sildenafil citrate by the viagra price canada producing company, Pfizer, an US based company, the name of which is Pfizer. This chart is from the last Figure in Abram et al 2013. Figure 4 Antarctic Peninsula temperature over the past millennium. a, 11-year moving average of JRI annual temperature anomaly (green) with Gaussian kernel smoothing filters at 5-, 10-, 20-, 30-, 40- and 50-year bandwidths (grey)

I find it interesting that their 1000 year temperature record from James Ross Island does not show a clear Medieval Warm Period.
Warwick,
What do you think of their LIA?
kerry
My main comments would be the depths of the LIA looks more restricted in time than I would expect – I am used to seeing multiple troughs. Also I am not accustomed to seeing 1920-30 portrayed similarly cold as circa 1680-1700.
Look at it upside down … now that’s more like it …
There are other oddities. For example, the trough c. 1910-1920. I would have expected that futher towards 1850 with the modern warming uptick commencing about then.
Is there any other Antartic ice core – or any other southern hemisphere temperature proxy that looks anything like this?
I am wondering just what we are really seeing a record of here.
And in contrast this paper published in Cryosphere yesterday www.the-cryosphere.net/7/303/2013/tc-7-303-2013.pdf
What did they MEASURE????
It is at odds with the conclusions of a study of a different core on James Ross Island where:
A 400 years isotope record of the Antarctic Peninsula climate Alberto J. Aristarain, Jean Jouzel, Claude Loriusfrom; GRL December 1990
onlinelibrary.wiley.com/doi/10.1029/GL017i013p02369/abstract
Thanks Ted for that link to Frezzottil et al 2013. Little alarming change to report I see. And KuhnKat here is a pdf of the Abram et al 2013 paper which is the topic of this post. About a MB.
A synthesis of the Antarctic surface mass balance during the last 800yr
M. Frezzotti1, C. Scarchilli1, S. Becagli2, M. Proposito1, and S. Urbini3
Abstract: Global climate models suggest that Antarctic snowfall should increase in a warming climate and mitigate rises in the sea level. Several processes affect surface mass balance (SMB), introducing large uncertainties in past,present and future ice sheet mass balance. To provide an extended perspective on the past SMB of Antarctica, we used 67 firn/ice core records to reconstruct the temporal variability in the SMB over the past 800yr and, in greater detail, over the last 200yr.
Our SMB reconstructions indicate that the SMB changes over most of Antarctica are statistically negligible and that the current SMB is not exceptionally high compared to the last 800yr. High-accumulation periods have occurred in the
past, specifically during the 1370s and 1610s. However, a clear increase in accumulation of more than 10% has occurred in high SMB coastal regions and over the highest part of the East Antarctic ice divide since the 1960s. To explain
the differences in behaviour between the coastal/ice divide sites and the rest of Antarctica, we suggest that a higher frequency of blocking anticyclones increases the precipitation at coastal sites, leading to the advection of moist air in the highest areas, whereas blowing snow and/or erosion have significant negative impacts on the SMB at windy sites. Eight hundred years of stacked records of the SMB mimic the total solar irradiance during the 13th and 18th centuries. The link between those two variables is probably indirect and linked to a teleconnection in atmospheric circulation that forces complex feedback between the tropical Pacific and Antarctica via the generation and propagation of a large-scale atmospheric wave train.
Thank you for the link.
As usual, no error bars. Abram , et al., used dH-2 (dD) proxy temperatures, which are typically calibrated using co-located dO-18 measurements. The dO-18 proxy is no more accurate than (+/-)0.5 C under the best laboratory conditions. That inaccuracy is primarily due to systematic methodological errors.
Under field conditions, the accuracy deteriorates to about (+/-)1 C. Considering that the absolute temperature magnitudes themselves are around 30 C, a (+/-)1 C accuracy is ~(+/-)3.3 % uncertainty in a derived temperature which isn’t bad at all.
But the uncertainty propagates into the anomaly. It’s not random and it doesn’t subtract away. Look at Abram Figure 4, and notice what minimal uncertainty bars of (+/-)0.5 C do to their conclusions. One can hardly say anything, even at 1-sigma. At 2-sigma (95% confidence), nothing at all can be concluded.
All of modern AGW-driven climate science has fallen into that careless neglect of systematic error. The whole field would collapse if they paid proper attention to detail. None of it is valid science anymore.
James Ross Island is about 350km north of the Antarctic Circle. What’s not generally appreciated is that around the SH mid-summer this region gets more solar radiation than anywhere on the planet, at any time of year, and is therefore unusually sensitive to cloud cover changes.
The abstract has the usual climate science trick of implying a cause, in this case that increasing temperatures are causing the melt, without specifically saying so.
Over the past 50 years, warming of the Antarctic Peninsula has been accompanied by accelerating glacier mass loss and the retreat and collapse of ice shelves. A key driver of ice loss is summer melting; however, it is not usually possible to specifically reconstruct the summer conditions that are critical for determining ice melt in Antarctic.
And you’d think at least one of the 9 authors would pick on ‘Antartic’. Even google spell check caught it.
Whoops. That should have been,
And you’d think at least one of the 9 authors would pick on ‘Antarctic’. Even google spell check caught it.
“Summer melting is now at a level that is unprecedented over the past 1,000 years.”
No it isn’t. The recent peak is no higher than that in ~1605 and the latest recorded value is only about average for the last 250 years. The “unprecedented level” is mostly just an artefact of the smoothing.
In any case, no MWP, no LIA, no signal for Tambora or Krakatoa, 1970s much warmer than 1940s – either this is just a heap of noise, which is what it looks like, or it’s a lousy proxy of global temperature, which is what we might have been interested in.
Noticed this graphic of MWP in the Law Dome oxygen isotope data
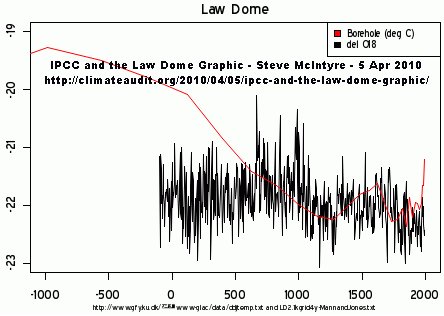
“IPCC and the Law Dome Graphic” – Steve McIntyre – 5 Apr 2010
Looks like something the IPCC warmistas have not wanted to show.