Thanks to Romanoz for alerting us to this fascinating research – see his comment #5. I now have the 20MB download – Antarctic Climate Change and the Environment – dated November 2009.
Under 2.1.2.7 Atmospheric data derived from ice cores
The last para on page 43 starts – Ice core sea-salt as a potential proxy for mid-latitude winter rainfall variability. The full text on p 43 & 44 is saved here if you click on “Read the rest of this entry” at the end of the post.
Fig 2.8 shows salt content of ice varying from 1300AD and the text says – [ The work in progress indicates that southwest Western Australia experienced periods of higher mean winter rainfall, with high interdecadal variability during 1300 to 1600 AD, followed by lower mean but less variable winter rainfall from 1600 to 1900 AD, which is similar to the past 50 years (Goodwin, in prep.).]

The text ends by saying – [This long record would be of enormous economic benefit to all water users in Western Australia.]
Fig 2.7 shows that in the phase illustrated in panel b, the SW of WA is affected by higher readings of MSLP (mean sea-level pressure) – more finer weather.

So WA water authorities and politicians should take note – there is evidence that pre-1975 SW WA rainfall was not some constant high-rain regime. The post-1975 lower rain regime may be a perfectly normal phase of long term cycles and nothing to do with Greenhouse as they have claimed ad nauseum – Chapter and verse for a decade or more.
2.1.2.7 Atmospheric data derived from ice cores – start p 43
Ice core sea-salt as a potential proxy for mid-latitude winter rainfall variability.
Recent work by Goodwin (in prep.) has focused on the application of the proxy mid-latitude MSLP and SAM index time series, to investigate methods for hindcasting southern Australian rainfall over the past millennium. Proxy May – July MSLP and SAM data have been cross- correlated against May – July total rainfall data for stations located in southwest and southern Western Australia. Preliminary results, indicate that the highest correlation between the data
was calculated for stations close to the coastal escarpment in southwest Western Australia, indicating the strong relationship between winter rainfall, the phase of the SAM and the circumpolar longwave circulation pattern, particularly the meridional location of the Rossby wave number 3 troughs and ridges in the Indo-Australian region. Interdecadal winter rainfall variability across coastal Southern Australia appears to be strongly associated with the time-varying behaviour of the longwave pattern and the SAM. The work in progress indicates that southwest Western Australia experienced periods of higher mean winter rainfall, with high interdecadal variability during 1300 to 1600 AD, followed by lower mean but less variable winter rainfall from 1600 to 1900 AD, which is similar to the past 50 years (Goodwin, in prep.). These preliminary results, illustrate the potential for using high-resolution (monthly) ice core glaciochemical data to reconstruct and predict atmospheric circulation and rainfall distribution patterns across Southern Australia at interannual to interdecadal resolution. Since there is a strong correlation between mid-latitude MSLP, South Indian Ocean sea surface temperatures (SST) and rainfall over southwest Western Australia (Smith I. et al., 2000) ice core sites in Queen Mary Land, East Antarctica appear to have the best potential for reconstructing MSLP and rainfall variability over southwest Western Australia for the past
few hundred years. This long record would be of enormous economic benefit to all water users in Western Australia.
See figure 2.15 at the link below, which gives a seasonal breakdown for several SW stations.
There is no question the climate got drier from around 1970 due to less winter rainfall. While there are numerous problems with surface temperature measurements, I expect rainfall measurements are pretty accurate.
www.clw.csiro.au/publications/waterforahealthycountry/swsy/pdf/SWSY_Climate_TechRpt.pdf
I do not think anybody here is questioning the post 1970 decline in SW WA rain.
But we are drawing attention to the lower annual rain numbers in Perth pre WWI – backed up by those 3 years in Fremantle – here is what I said on an earlier thread.
[Climate change doomsters sure have dined out for years on SW WA rain trends post mid 1970’s being the fate of the rest of us. The WA water authorities and WaterCorp have been leaders and their post-rain propaganda has all been worked in to the successful pro-seawater desal construction push in the Eastern States. That our Grandchildren and their offspring will be paying for.
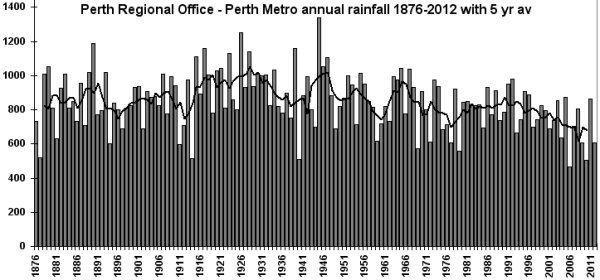
Here is the Perth annual rain data and I have often pointed out that the period 1876 to pre WWI the totals look more similar to post mid 1970’s than the high rain years 1915 to ~1970.
And who is to say what is normal ? The doomsters assert that the high rain years are “normal” and that “climate change” has taken our rain.
I see there is a Fremantle station 9017 with three totals from 1853 869.2mm, 1854 757.7mm & 1855 768.9mm which lend support to the notion that pre WWI rain levels were in a lower band than 1915-1070.
It will be welcome if there is some fresh research in the pipeline to provide an alternative view to the decade of propaganda.]
It is refreshing to find this Antarctic research in the pipeline showing cycles in Antarctic snowfall on centuries timescales which appear to show links to SW WA rain. Supporting the notion that the low rain regime SW WA has been in from ~1970 is by no means unusual. Contrary to the greenhouse propaganda WA Govts and water quangos have been blitzing the media with for a decade.
It is interesting too that the mid-70’s decline in SW WA rain corresponds with the much published about mid 1970’s shift in the PDO – see what BoB Tisdale says – The 1976 Pacific Climate Shift –
The PDO graphics and latest data – the 1976 shift shows up well in the PDO graphics. I realize that although the PDO is negative again now – that does not seem to be helping SW WA rain.
In the last week when I was trying to track down the Goodwin research I asked the Antarctic Division. They did not know but put me on to this similar research from 1900. Research by Tas Van Ommen which I had been aware of – but it only deals with the 20th Century.
Warwick, I wasn’t disputing what you said. Just emphasizing the decline in winter rainfall was real and substantial.
The drying SW climate was based on the predicted poleward shift of the climate zones. Not something you hear much about these days, because it didn’t happen to the extent the models predicted.
The graphs at my link above tell an interesting story. Rainfall has decreased all along the coast, but inland to the east and southeast of Perth rainfall has increased. These areas are the highest parts of the Darling Ranges. Fig 2.6.
What seems to have happened is that rain that previously fell on coastal areas is now falling on the hills.
It’s well documented that urban development decreases rainfall over the urban area but increases rainfall downwind (primarily an aerosol effect). And the coastal strip has seen rapid urbanization over the last few decades.
I’d argue that urban aerosols have significantly contributed to the reduce coastal rainfall. Not that I am arguing this is the whole story, and generally agree with Bob Tisdale says.
If you look at the rainfall graphs for Deeside and Mount Barker, locations not downwind from the coastal plain development, rainfall hasn’t changed much.
As a stock agent in the 1970s in the SWest, there were still some horrid droughts in the wheatbelt, particularly the SEast, worse than any recent ones. Land clearing was in its heyday in all wheatbelt areas, especially more marginal eastern areas. In a lot of zones the only vegetation left is on roadsides. Salt was just starting to invade farmland.