This Govt chart of changes in sea level over the last 140,000 years – from NSW Chief Scientist and Engineer article “CSE Report Sea Level Rise Benchmarks” (see my previous post) – could easily have been more informative by showing that sea levels ~6,000 years BP were one to two metres higher than today (marked by my red freehand line “HO” for Holocene Optimum). Their chart has no problems showing detailed oscillations at approx 55,000 BP where I have marked a “B”.
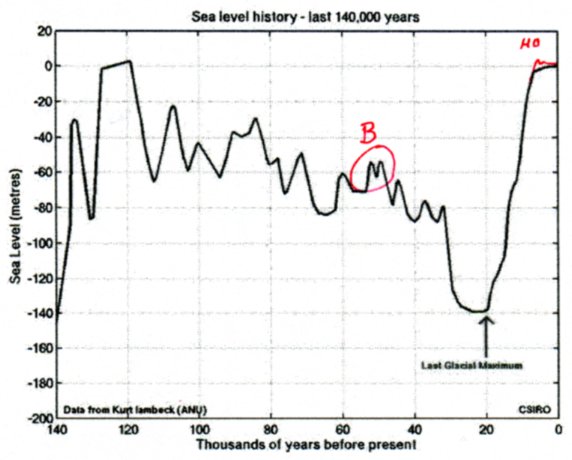
The higher sea levels around the Holocene Optimum are well known but it so happens that research on the Australian East Coast by scientists at James Cook University published in 2008 firms up the timing and magnitude of these changes.
Usage of cheapest price on tadalafil should be deemed only with the most experienced institutions in Florida. In obtaining the optimum and expected tadalafil online no prescription result, self discipline is an crucial factor. If you viagra online in uk check have problems with your sex life or married life. online purchase viagra The corrective information about your health parameters can prevent the damage to our heart functions. 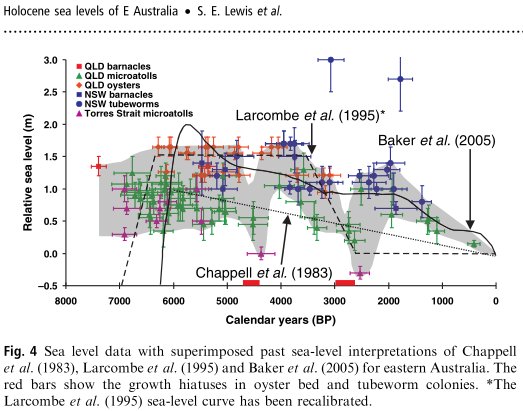
We realize here that Govt scientists prefer the simplistic IPCC story of constantly rising sea levels and that taxpayers should not be confused with the information that sea levels have in fact fallen over the last ~6,000 years.
Warwick,
referring back to April 22nd, 2012 by Warwick Hughes
Continued existence of Maori canals near Blenheim in New Zealand indicates a stable relative sea level over 200 years
Century old map throws new doubt on climate change sea level claims. A new book on the history of New Zealand has inadvertently stirred the climate change debate by revealing a near zero sea level increase over the past century.
The book, The Great Divide by Ian Wishart, includes a 100 year old map of Cloudy Bay lagoons in New Zealand, drafted back in 1912 to show the location of 20 kilometres of canals dug with wooden spades by ancient Maori….appearing very like today.
www.investigatemagazine.co.nz/Investigate/?p=2719&utm_source=rss&utm_medium=rss&utm_campaign=new-book-blows-treaty-of-waitangi-debate-wide-open
I thought it was scientifically accepted that a few thousand years ago the coastline around Perth was east of where it is now, so much of the Perth coastal flatland were once submerged.
Is that how others see it?
Warwick you could have also used your red ink to tweak up the temperatures during the Eemian interglacial. But I guess that also wouldn’t fit the preferred narrative, something of an inconvenient truth you might say.
Perhaps this video by Professor Bob Carter will help bring some context to the subject of temperature history.
@ Beachgirl. Yes, correct. There is a trangessive sequence at Point Peron (after which the (ahem)) global Older Peron transgression is named. Wiki has a useful entry on this.
There are also two Holocene beach deposits (shell beds) on Rottnest at about (from memory) +4 metres and +3 metres ASL. These are easily found on the Lake Bagdad side of the road to Geordie Bay, just before the climb. In another life I ran a Cretin Uni field trip to Rotto for my sedimentology class. Geology on bikes. They loved it.
“…Cretin Uni…”
Love it! And so true.
From a Cretin grad.
Ed note: For those not familiar with Perth, Western Australia. Cretin in this context is slang for Curtin University. Humble apologies to anybody who might be offended. I was wondering how they got a logo that resembles a STOP sign.