In view of the constant negative media articles about Kwinana and
Perth air pollution, CAPS has put together this page comparing air
monitoring data from Kwinana and Perth with comparable data from Los Angeles and
the Eastern States.
It is clear that Perth has very little in the way
of significant air quality problems and we have to ask why it is that the
media gives us such a slanted view.
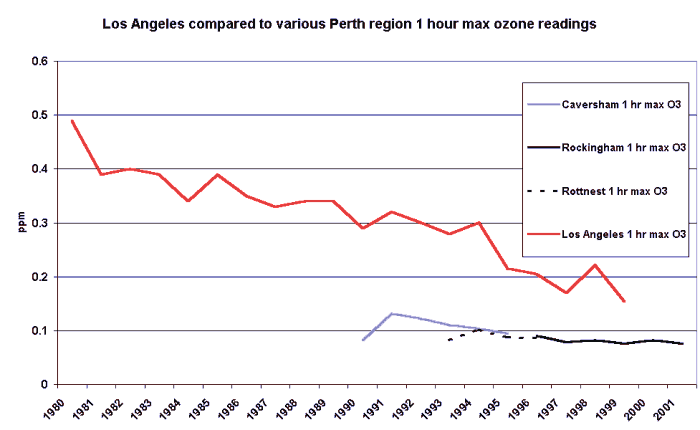
So looking first at ozone (and remember this is
not the ozone in the stratosphere), we see the steady
reduction in Los Angeles ozone over the two decades, yet LA peak levels are
still almost twice standards set by the US EPA or the State in the 0.08 to 0.12
ppm range. In fact much of California exceeds these standards. Rockingham ozone
levels are just under the 0.1 ppm standard but this only happens on a few
very hot days for the few hours when the sun is at a maximum and it is
interesting that Rottnest ozone levels are very similar to Rockingham, yet
precurssors are much less concentrated at Rottnest. It looks as though once you
get around the 0.1 ppm level for summer hot day peaks there could be natural
species in the air contributing to ozone peaks. The ASL website (see links)
points out that many US localities will never attain the EPA ozone standards and
that in many rural places air can exceed these standards. All
suggesting natural causes for ozone around the 0.1 ppm level. On the
Western Australian DEP website they only discuss pollution causes for
ozone, there is no hint that ozone can have natural causes. This is a
point where I think the DEP is wrong but hey !!, it might upset the Greens to
have to be told that high ozone levels can have natural causes.
Inhalable dust particles are measured in several ways but PM 10 refers
to particles under 10 microns in diameter, which encompasses dust
from various souirces natural & industrial and bushfire smoke. Perth
levels are generally under the 50 u/gm per m3 averaged over 24 hours standard
but most of California exceeds this criteria. 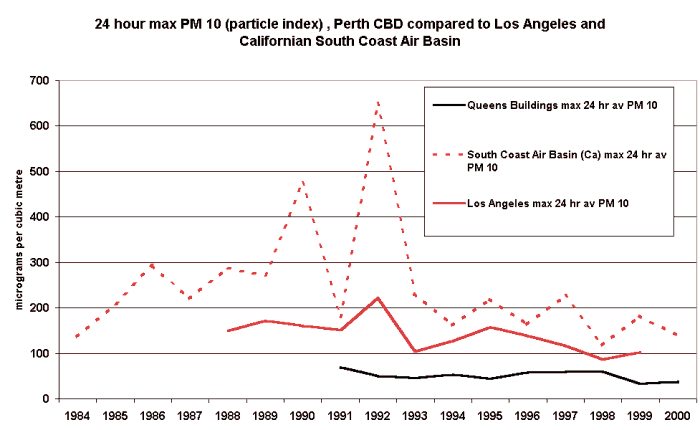
Carbon
monoxide is a poisonous gas produced in combustion, meaning that vehicle
engines are a significant source. Improvements in engine design and fuel
standards have contributed to greatly reduced levels of CO despite more vehicles
being on the roads. The standard in Perth and California is 9 ppm over 8
hours. 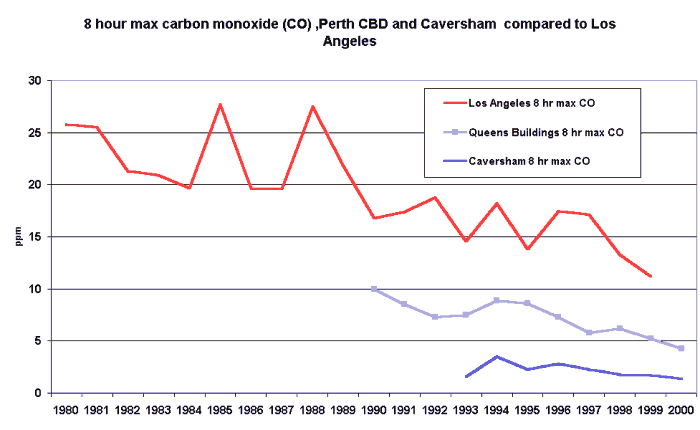
Nitrogen dioxide NO2 is also a product of combustion and at
levels measured in Perth is of little concern to health, however it plays a role
in ozone formation. The Perth standard is 0.12 ppm over 1 hour and it is
not clear what the California standard is but all areas are said to be attaining
the standard. 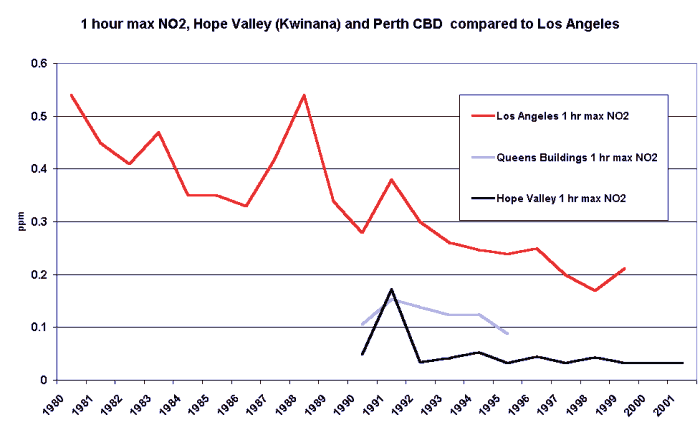
Sulphur dioxide or SO2
forms from the combustion of fuels containing sulphur. Continued improvements in
fuels and scrubbers in smokestacks have all helped to reduce sulphur in the
air. The Perth standard is 0.08 ppm =~228 micrograms per cubic metre. Some
comparisons with eastern States industrial areas have been included where data
can be gleaned. 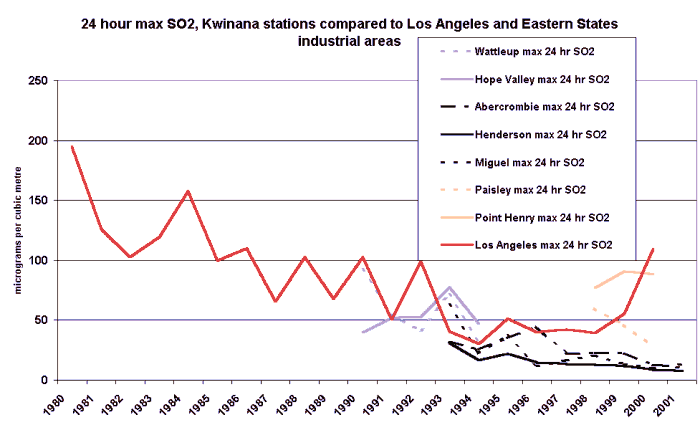
The current national NEPM 1 hour
standard for sulphur dioxide is 0.2 ppm and it is plain that Kwinana air
readings have been well within this since 1995. It is not clear from the
California Almanac what their SO2 standard is but current levels seem to cause
little concern. The ES areas probably use the same 0.2 ppm standard.
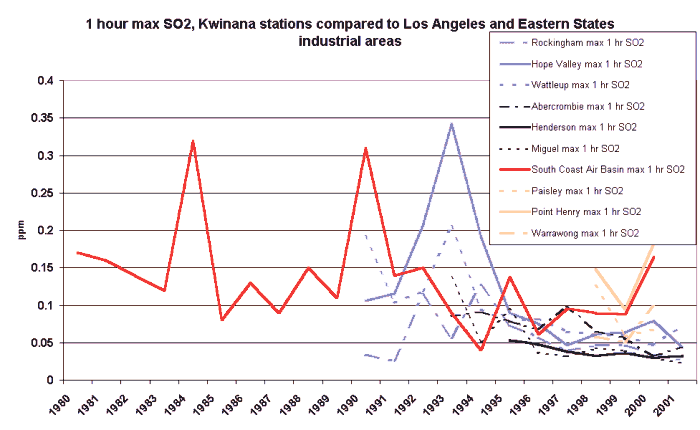
So we can see that Perth and Kwinana air quality compares very well with that from other comparable regions.
LINKS
Kwinana Industries Council
http://www.kic.org.au
WA Dept of Environment, data on air monitoring
http://www.environ.wa.gov.au
Melbourne air quality, also Greenhouse Issues. Posted 27, September 2002, updated 19, May 2003 